
Figure 2.
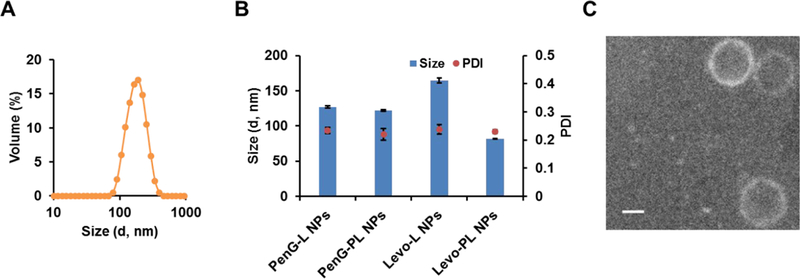
Characterization of antibiotic-derived lipid nanoparticles. (A) Size distribution of the selected formulation 6, PenG-L NPs. (B) Size distribution of antibiotic-derived lipid nanoparticles. Mean ± SD (n=3). (C) A TEM image of PenG-PL NPs. Scale bar = 100 nm.