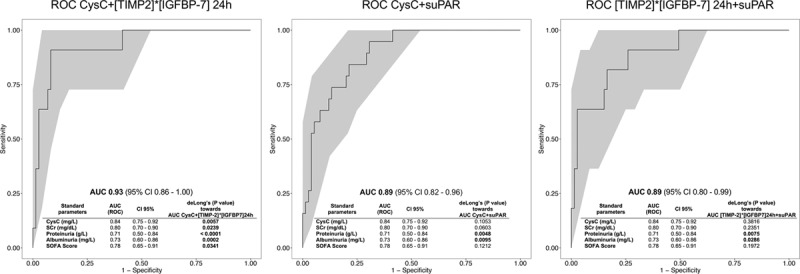
Figure 3.

Bivariate logistic regression models and ROC analyses of biomarker combinations in comparison to standard parameters (deLong’s test) using [TIMP-2] × [IGFBP7] 24 hr, suPAR, and CysC. AUC = area under the ROC curve, CysC = Cystatin C, ROC = receiver operating characteristics, SCr = serum creatinine, SOFA = Sequential Organ Failure Assessment, suPAR = soluble urokinase-type plasminogen activator receptor, [TIMP-2] × [IGFBP7] = product of tissue inhibitor of metalloproteinase-2 and insulin-like growth factor-binding protein 7. Boldface values indicate p < 0.05.
