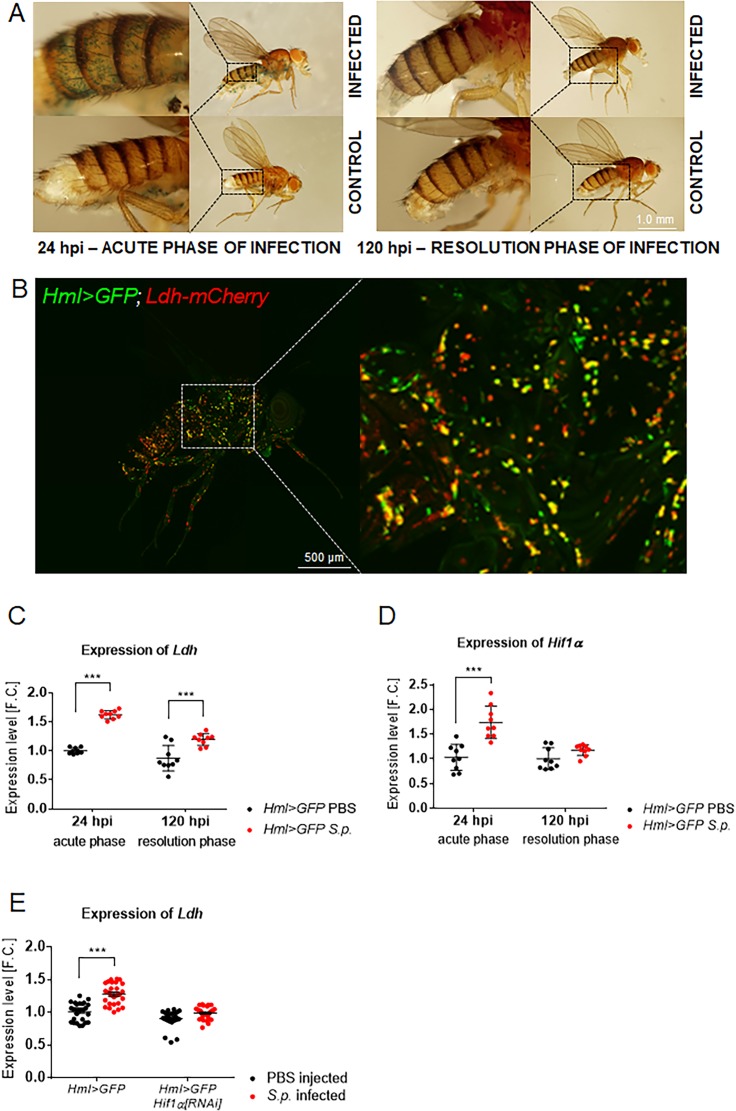
Figure 3. Macrophage-specific activities of Hif1α and Ldh increase upon infection.
(A) X-gal staining of infected and control flies bearing the HRE-LacZ reporter construct. Images represent a minimum of ten observations of a similar pattern. (B) An uninfected Hml >GFP, Ldh-mCherry adult fly (24 hpi) shows localization of the Ldh reporter activity (red) in many of the immune cells (green). The image is a Z-stack at maximal projection of 25 confocal slices. (C, D) Expression of Ldh (C) and Hif1α (D) mRNAs in hemocytes isolated from infected and control flies (both Hml >GFP; 24 and 120 hpi). (E) Expression of Ldh mRNA in hemocytes of infected and control Hml >GFP flies with and without a hemocyte-specific knockdown of Hif1α at 24 hpi. In all plots (C–E), expression levels, normalized against rp49, are given as fold change (F.C.) relative to levels in PBS-injected Hml >GFP controls (24 hpi), which were arbitrarily set to 1. Individual dots represent biological replicates. Values are mean ± SD, asterisks mark statistically significant differences (*p<0.05; **p<0.01; ***p<0.001).

