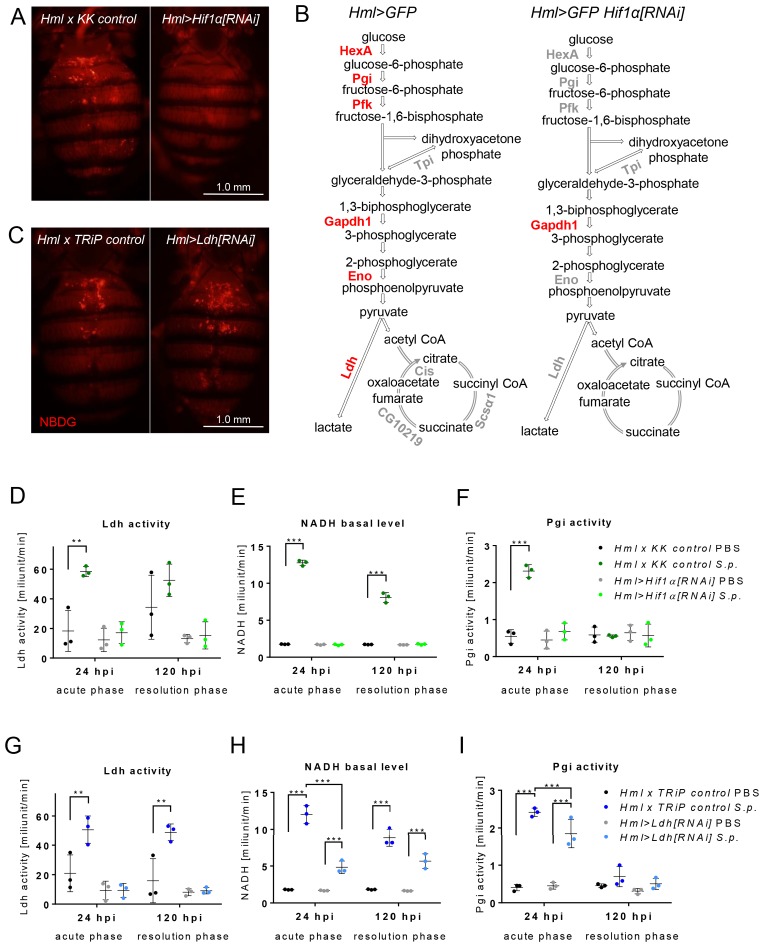
Figure 4. Effects of Hif1α and Ldh hemocyte-specific knockdown on macrophage metabolism.
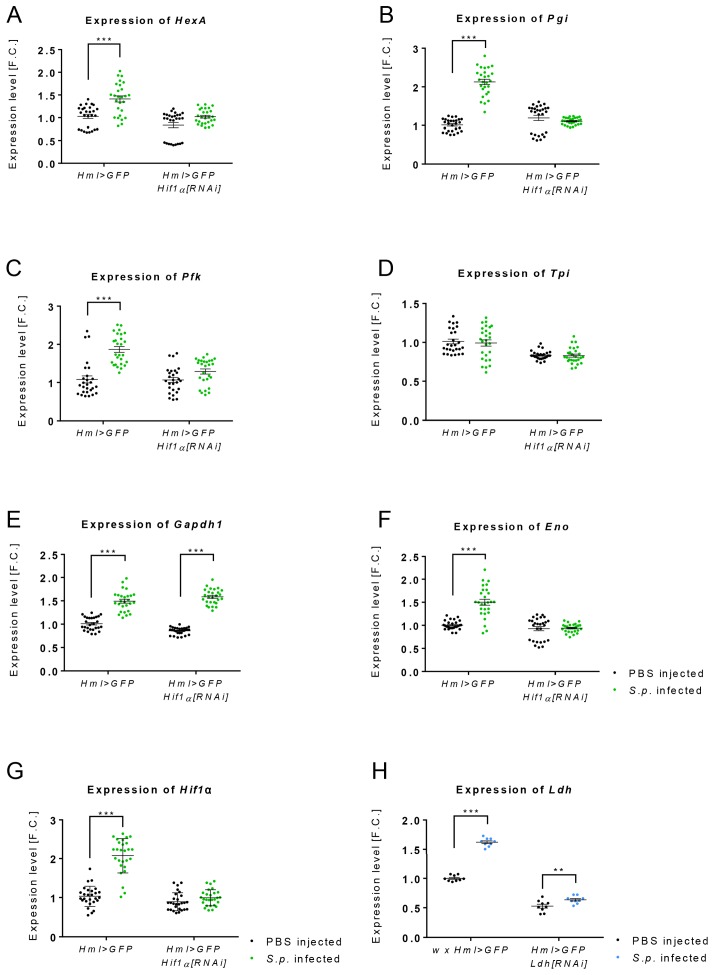
(A) Dorsal view of the abdomens of S.p.-infected flies (24 hpi) showing the distribution of the fluorescent NBDG probe. Controls (left) are compared to flies subjected to hemocyte-specific knockdown of Hif1α. Images represent a minimum of ten observations of a similar pattern. (B) Schematic representation of the expression of genes encoding metabolic enzymes in the hemocytes of infected control flies (left) and of flies with Hif1α hemocyte-specific knockdown (right) at 24 hpi. The expression levels of the mRNAs were measured relative to that of rp49, and the statistical significance (p<0.05) was tested using ANOVA (for data see Figure 4—figure supplement 1). Upregulated genes are shown in red; gray indicates no statistically significant difference. (C) Dorsal view of the abdomens of S.p.-infected flies (24 hpi) showing the distribution of the fluorescent NBDG probe. Controls (left) are compared to flies subjected to hemocyte-specific knockdown of Ldh. Images represent a minimum of ten observations of a similar pattern. (D–F) Enzymatic activity of Ldh (D), level of NADH (E), and enzymatic activity of Pgi (F) at 24 and 120 hpi measured in lysates of hemocytes isolated from infected and non-infected control flies and from flies with Hif1α hemocyte-specific knockdown. (G–I) Enzymatic activity of Ldh (G), level of NADH (H), and enzymatic activity of Pgi (I) at 24 and 120 hpi measured in lysates of hemocytes isolated from infected and non-infected control flies and from flies with Ldh hemocyte-specific knockdown. In all plots (D–I), the enzyme activities and NADH concentrations were normalized per ten thousand cells per sample. Individual dots represent biological replicates. Values are mean ± SD, asterisks mark statistically significant differences (*p<0.05; **p<0.01; ***p<0.001).


