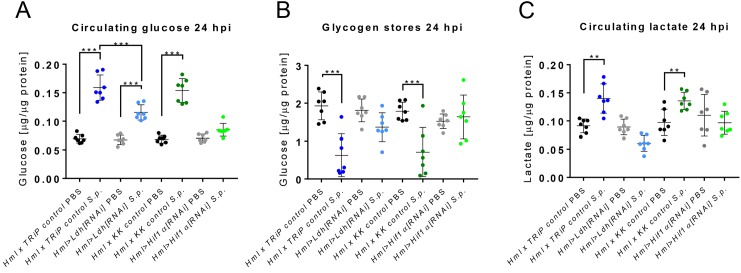
Figure 5. Systemic effects of Hif1α and Ldh hemocyte-specific knockdown.
(A–C) The concentration of circulating glucose (A), glycogen stores (B) and circulating lactate (C) in infected and non-infected flies with Hif1α or Ldh hemocyte-specific knockdown and their respective controls at 24 hpi. The concentrations of metabolites were normalized to the amount of proteins in each sample. Individual dots in the plot represent biological replicates. Values are mean ± SD, asterisks mark statistically significant differences (*p<0.05; **p<0.01; ***p<0.001).

