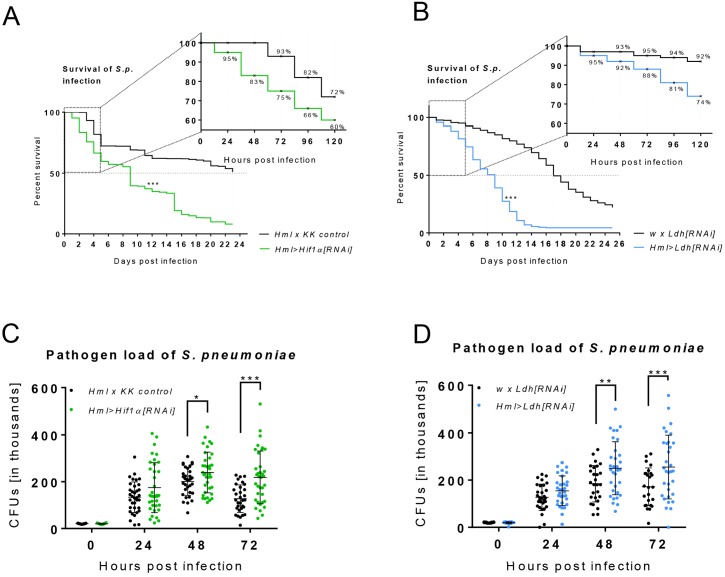
Figure 6. Effects of Hif1α and Ldh hemocyte-specific knockdown on resistance to infection.
(A–B) The survival rate of infected flies of the control genotype and of flies with hemocyte-specific Hif1α (A) and Ldh (B) knockdown. Vertical dotted lines denote medium time to death for each genotype; survival rate during the first 120 hr is shown in detail. Three independent experiments were performed and combined into one survival curve. The average number of individuals per replicate was more than 500 for each genotype. (C, D) Colony forming units (CFUs) obtained from infected flies of control genotype and from flies with hemocyte-specific Hif1α (C) and Ldh (D) knockdown at 0, 24, 48, and 72 hpi. Individual dots in the plot represent the number of bacteria raised from one individual. The data show results merged from three independent biological replicates.

