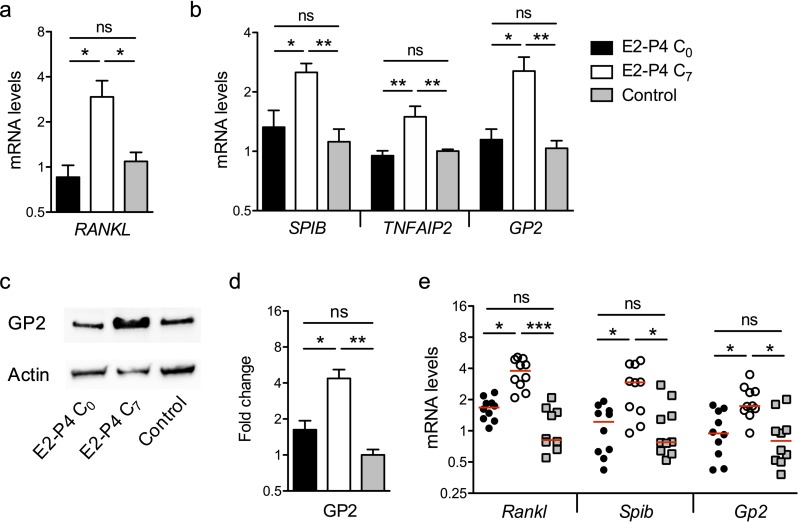
Figure 4. E2-P4 C7 concentrations promote intestinal M cells maturation.
(a–d) The epithelial layer composed of enterocytes and M cells was prepared as described in Figure 3. Following 6 days of Caco-2 and Raji co-culture, lymphocytes and epithelial cells were recovered and lysed for gene and protein expression analysis. (a) Raji B lymphocytes mRNA levels of RANKL. (b) Caco-2 mRNA levels of Spi-B-dependent M cells differentiation genes. (a–b) Results are normalized to ACTIN and expressed as mean fold change relative to control condition ± SEM. (c–d) Western blot analysis of GP2. (c) Representative sample blot and (d) quantification of GP2 protein levels. Values are presented as the ratio between GP2 and Actin and expressed as mean fold change relative to control condition ± SEM.≥3 experiments in duplicate. (e) SPF 3-week-old mice were administered E2-P4 cocktails as described in Figure 1. At the end of the hormonal treatment, Peyer’s patches were recovered for mRNA quantification of M cells differentiation markers. Results are normalized to Actin and expressed as mean fold change relative to control condition ± SEM (n = 10 mice per group). *p<0.05, **p<0.01, ***p<0.001, ns: not significant (Kruskal-Wallis test).

