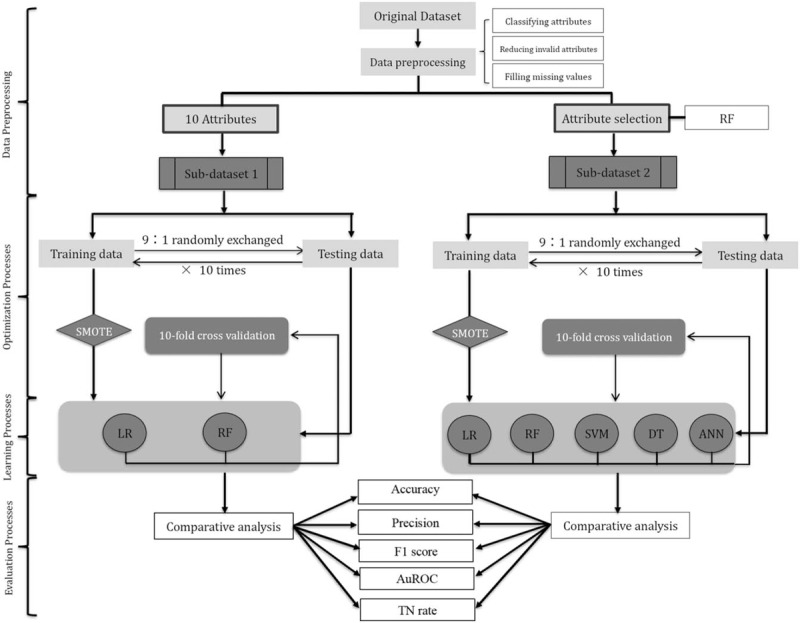
Figure 2.

The flowchart of experiments. The 10 attributes in “Sub-dataset 1” included: age, gender, disease location, HBI, stool frequency, immunosuppressive use, 5-aminosalicylate use, presence of a fistula, presence of an abscess, and presence of an abdominal mass; the 30 attributes in “Sub-dataset 2” were selected by random forest (RF). Both sub-datasets were divided into the training set and the testing set with the proportion of 9:1. In learning processes: applying and validating logic regression (LR) and RF models on “Sub-dataset 1” with the synthetic minority over-sampling technique algorithm (SMOTE) on the left side, while applying and validating RF, LR, decision tree (DT), support vector machine (SVM) and artificial neural networks (ANN) on “Sub-dataset 2” in the similar way on the right side. 10-Fold cross-validation was performed to train and test the generated predictive models. Five metrics were collected: accuracy, precision, F1 score, true negative (TN) rate, and area under the receiver operating characteristic curve (AuROC).
