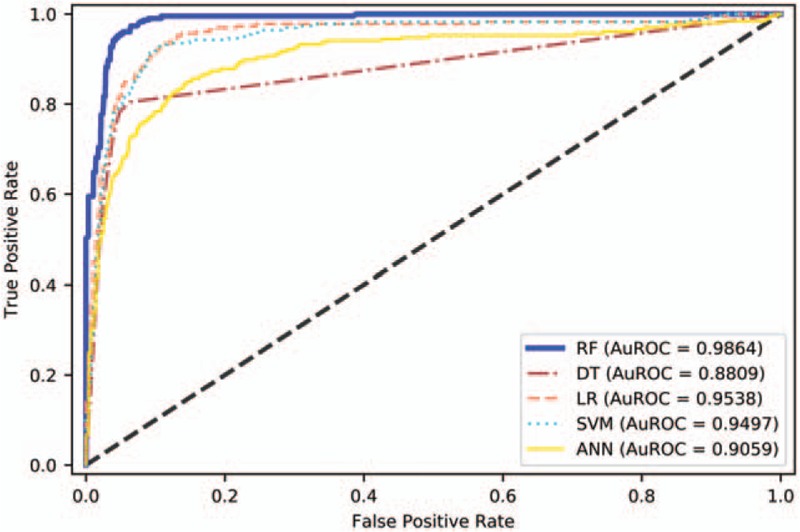
Figure 5.

Area under the receiver operating characteristic curve of models on sub-dataset 2. AuROC demonstrates the trade-off between false positive and true positive rates. The closer the curve follows the upper-left corner, the higher the overall accuracy of the model. ANN = artificial neural networks, DT = decision tree, LR = logic regression, RF = random forest, SVM = support vector machine.
