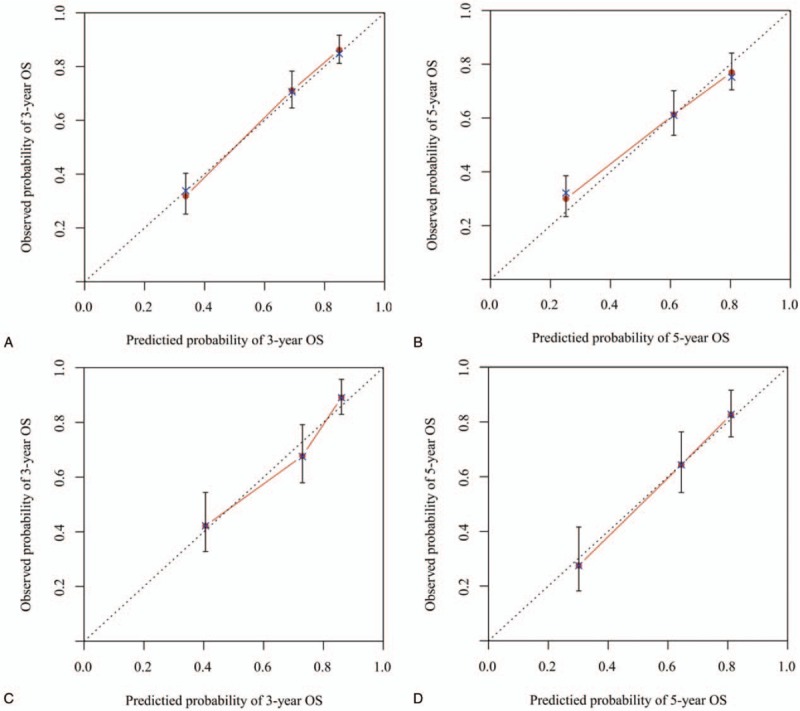
Figure 3.

Calibration plots of the nomogram for 3-and 5-year overall survival (OS) (A, B) prediction in the training set, and 3-and 5-year OS (C, D) prediction in the validation set. The X-axis represents the nomogram-predicted probability of survival; the Y-axis represents the actual OS probability. Plots along the 45-degree line indicate a perfect calibration model in which the predicted probabilities are identical to the actual outcomes. Vertical bars indicate 95% confidence intervals.
