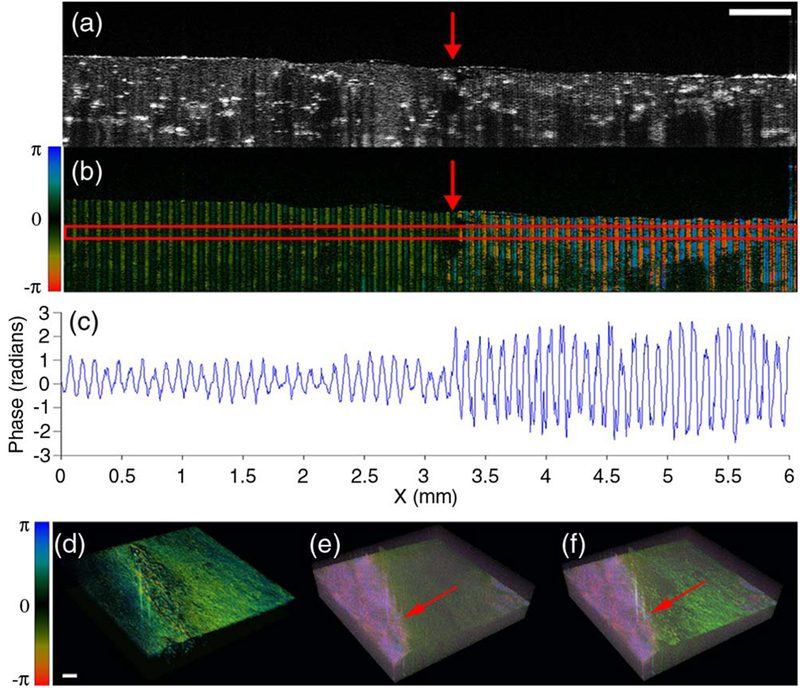
Figure 1.
Vibration amplitude measurements for elasticity mapping using ARF–OCE in a side-by-side agar phantom. (a) OCT intensity image. The right part is softer than the left part. (b) Doppler phase shift image with ARF excitation. (c) Phase amplitudes. (d) 3D OCT, (e) 3D OCE, and (f) fused OCT and OCE images. Scale bars: 500 μm. The figure has been reprinted with permission from Qi et al., 2012. Copyright © (2012) SPIE (45).

