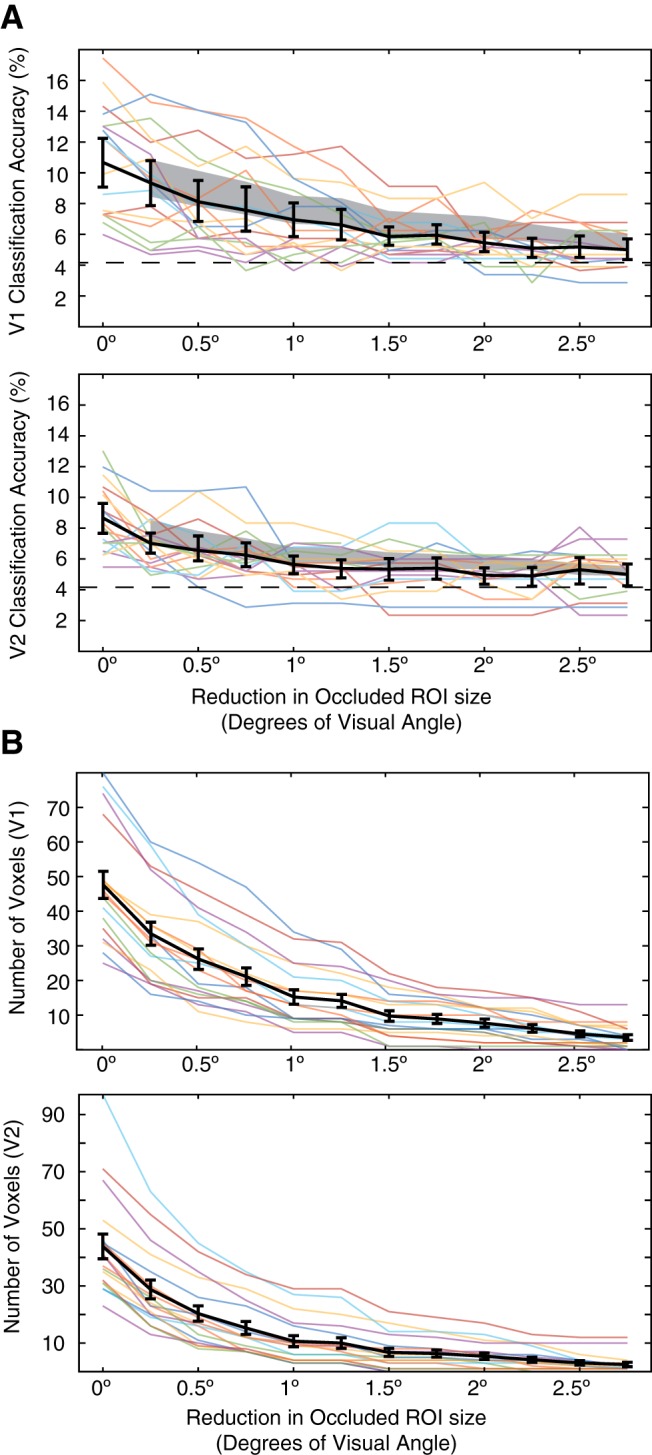
Figure 3.

Classification performance in restricted occluded ROIs. A, Classification performance is displayed for V1 and V2 ROIs that were restricted to exclude the area near the border of the occluder. The leftmost column shows classification performance for the full occluded area (as in Fig. 2). Each column to the right shifts the border of the ROI by 0.25° visual angle (up to 2.75°), thus excluding voxels with pRFs near the border of the occluder. Colored lines show individual subject classification performance and black lines shows the mean performance across subjects with 95% CI. The gray shaded area shows performance when the same number of voxels are removed from each ROI, but randomly selected rather than being close to the border of the occluded area (95% CI on the mean). B, The number of voxels included in each subject's ROI are shown by colored lines. Black lines indicate the mean number of voxels (and SE) in each ROI.
