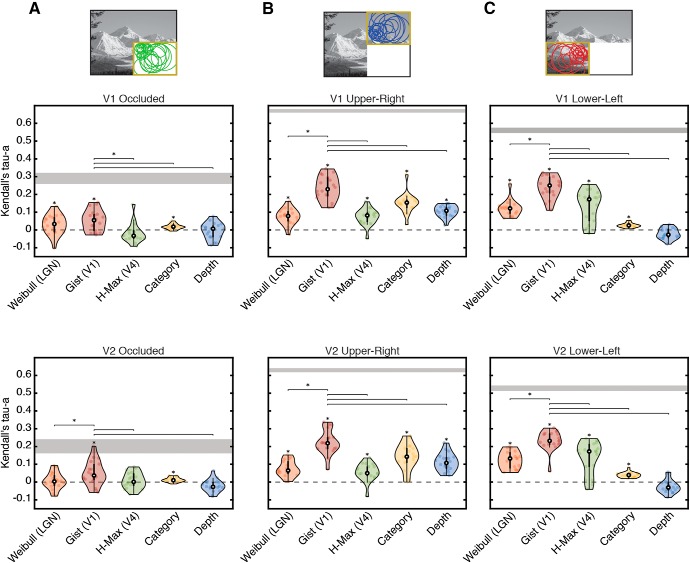
Figure 7.
Comparison of scene-specific and global models with cortical representations. The similarity of each model with cortical representations in (A) occluded and (B, C) non-occluded quadrants of V1 and V2 is shown as a rank correlation (Kendall's Tau-a). The Weibull (LGN contrast processing), Gist (orientation and spatial-frequency processing), and H-Max (mid-level visual feature processing) model features were computed from visible scenes for non-occluded areas, and from line drawings for occluded areas. Global feature models included Category and Depth (depth measurements were determined in a separate behavioral experiment). Individual subject data are shown as dots, and data distributions were computed using kernel density estimation. Asterisks directly above data indicate significantly greater than zero correlations (p < 0.05, one-sided Wilcoxon signed rank test). Lines between models indicate significant differences in performance between the Gist model (the best performing model in all areas) and other models. Noise ceilings were calculated as the upper and lower bounds on individual subject correlations with an average representational structure.

