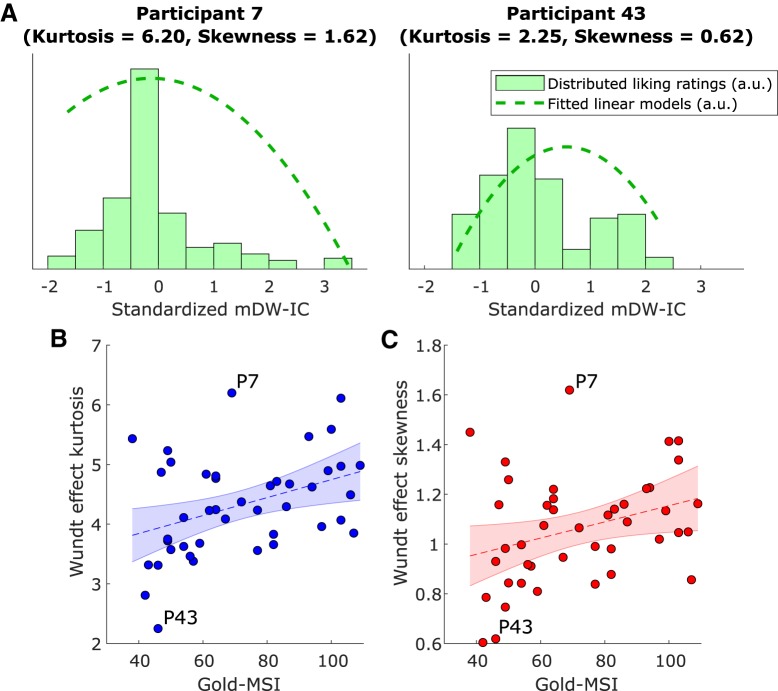
Figure 4.
Individual differences in Wundt effects. Individual differences in the Wundt effects of Study 1 could be explained in part by musical sophistication, as measured by the Gold-MSI (Müllensiefen et al., 2014). A, We represented each participant's Wundt effect as a distribution of mean liking ratings across mDW-ICs by multiplying these measures together, resulting in flatter distributions for those with similar preferences across the mDW-IC spectrum, sharper distributions for those with more particular preferences, and so on. We then measured the kurtosis and skewness of each distribution, reflecting the sharpness and asymmetry of the participant's preferences, respectively. To illustrate this analysis, we show the distribution for Participant 7, on the left, who exhibits the greatest kurtosis and skewness of the sample, and Participant 43, on the right, who has the lowest kurtosis and second-lowest skewness. B, There was a significant positive correlation between Gold-MSI scores and the kurtosis of the Wundt effect, revealing sharper preferences for relatively more sophisticated participants (F(1,41) = 7.43, p = 0.009, β = 0.02, R2 = 0.15). C, There was also a significant positive correlation between Gold-MSI scores and the skewness of the Wundt effect, wherein more sophisticated listeners also had greater relative preferences for stimuli of lower mDW-IC (F(1,41) = 4.76, p = 0.03, β = 0.003, R2 = 0.10). In both cases, the Gold-MSI “Perceptual Abilities” subscale was the only one to survive follow-up stepwise regressions (kurtosis effect: F(1,41) = 6.50, p = 0.01, β = 0.04, R2 = 0.14; skewness effect: F(1,41) = 5.89, p = 0.02, β = 0.009, R2 = 0.13), indicating that music-listening skills drove these results. Kurtosis and skewness were also highly correlated (r = 0.94, p < 0.001), complicating the interpretations of these results. P7 = Participant 7, P43 = Participant 43.

