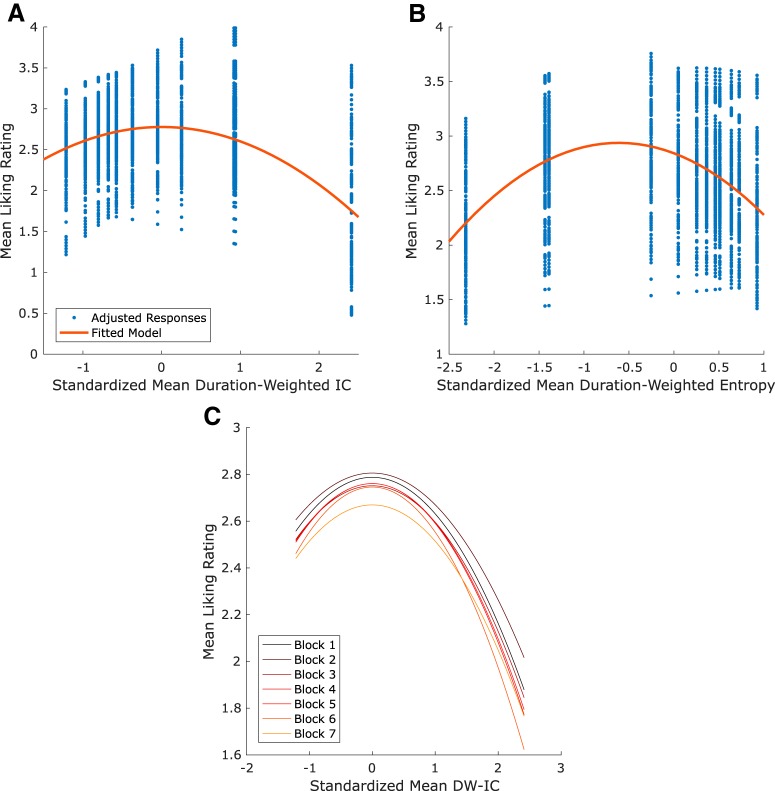
Figure 5.
Behavioral effects of unpredictability, uncertainty, and repetition. Linear mixed-effects analyses revealed significant Wundt effects in Study 2. A, The optimal model of mDW-IC explained 41.6% of the variance in liking ratings (p < 0.001) with only a negative quadratic effect (β = −0.18, p < 0.001) and significant random intercepts and slopes across subjects (intercept 95% CI = 0.31, 0.58, mDW-IC slope 95% CI = 0.15, 0.29, mDW-IC2 slope 95% CI = 0.10, 0.19, repetition slope 95% CI = 0.05, 0.09). Red curve represents the fitted model. Blue dots represent the mean liking ratings for each stimulus adjusted according to the model's random effects. B, The optimal model of mDW-Ent explained 34.9% of the variance in liking ratings (p < 0.001), with negative linear (β = −0.31, p < 0.001) and quadratic effects (β = −0.25, p < 0.001). This model also had significant subject-varying random intercepts (95% CI = 0.30, 0.58), slopes for mDW-Ent (95% CI = 0.26, 0.49), slopes for mDW-Ent2 (95% CI = 0.82, 0.97), and slopes for repetition (95% CI = 0.05, 0.09). Red curve represents the fitted model. Blue dots represent the mean liking ratings for each stimulus adjusted according to the model's random effects. C, The best-fitting model of liking and repetition, which included an interaction term between mDW-IC and liking, significantly fit the data (R2 = 0.42, p < 0.001), but not better than an alternative model that excluded the fixed effects of repetition (likelihood ratio test χ2(1, N = 27) = 3.42, p = 0.18). Even so, this model indicated that the Wundt effect did not significantly change across repetitions, as the interaction term was not significant (p = 0.38).

