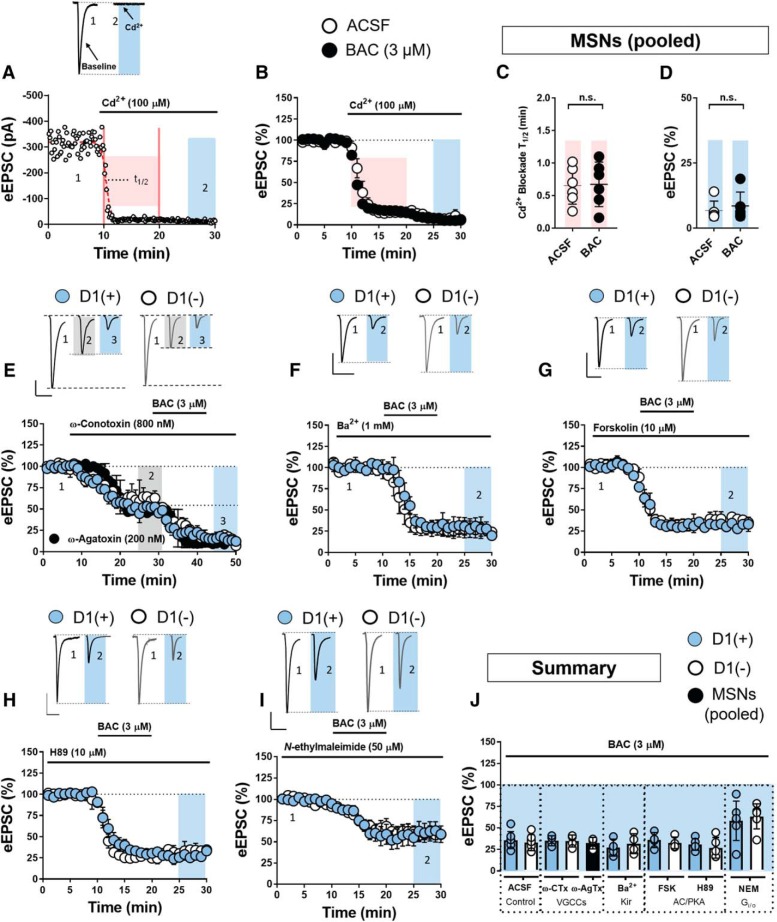
Figure 3.
GABABR activation recruits a non-canonical intracellular signaling mechanism to reduce glutamate release probability onto MSNs in the NAc core. A, Representative experiment and rough traces of the Cd2+-induced blockade of eEPSC from pooled MSNs the time interval from which T1/2 is obtained. B, Time course summary in ACSF and BAC (3 μm) -infused ACSF. C, D, Quantified kinetics (pink-shaded region) and magnitude of the Cd2+ block (blue-shaded region). Scale bar (for all traces), 100 pA/50 ms. E, Time course summary and representative traces showing that N-type VGCC blocker, ω-CTx (800 μm), failed to occlude the effects of BAC on eEPSC amplitude at D1(+)MSNs (blue circles) and D1(−) MSNs (open circles; t = 45–50 min, blue-shaded region, averaged). Black circles indicate time course summary for pooled MSNs of experiments performed with P/Q-type VGCC blocker, ω-AgTx (200 nm), instead of ω-CTx. ω-AgTx also failed to occlude the effects of BAC. F, Time course summary and representative traces showing effect of Kir channel blocker, Ba2+ (1 mm), on BAC-induced decrease in eEPSC amplitude at D1(+) and D1(−) MSNs. G, Time course summary and representative traces showing effect of AC activator, forskolin (10 μm), on BAC-induced decrease in eEPSC amplitude at D1(+) and D1(−) MSNs. H, Time course summary and representative traces showing effect of cell-permeant PKA inhibitor, H89 (10 μm), on BAC-induced decrease in eEPSC amplitude at D1(+) and D1(−) MSNs. I, Time course summary representative traces showing that NEM (50 μm) blunted but did not block the effects of BAC on eEPSC amplitude at D1(+) and D1(−) MSNs. J, Summary graph of BAC-induced decrease in eEPSC amplitude at D1(+) and D1(−) MSN synapses following various pharmacological manipulations. Error bars indicate SEM. *p < 0.05, n.s., not significant.

