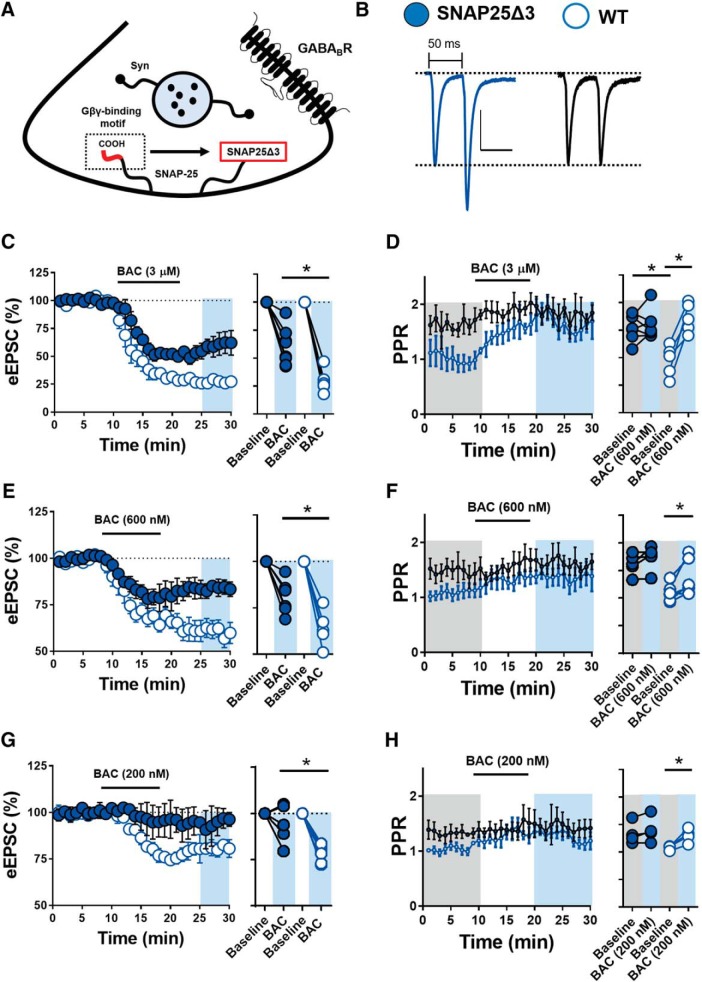
Figure 6.
Genetically reducing the Gβγ-SNAP-25 interaction blunts the synaptic effect of GABABR at glutamatergic synapses in the NAc core. A, Schematic of presynaptic terminal with C-terminally truncated SNAP-25 in transgenic SNAP25Δ3 mouse. Syn indicates SNAP-25 binding partner, synaptotagmin-1. B, Representative traces of averaged 50 ms paired-pulse eEPSCs in SNAP25Δ3 (left, blue circle) and WT mice (right, open circle). Basal PPR at 50 ms is significantly increased in SNAP25Δ3 mice relative to WT littermate controls. Scale bars, 100 pA/50 ms. C, Time course summary of eEPSC amplitude obtained from unlabeled MSNs in SNAP25Δ3 mutant mice (blue circles) and WT littermate control mice (open circles) in the presence 3 μm BAC. D, PPR time course summary and averages pre-BAC (gray area) and post-BAC (blue area) at 3 μm. E, Time course summary of eEPSC amplitude obtained from unlabeled MSNs in SNAP25Δ3 mutant mice (blue circles) and WT littermate control mice (open circles) in the presence 600 nm BAC. F, PPR time course summary and averages pre-BAC (gray area) and post-BAC (blue area) at 600 nm. G, Time course summary of eEPSC amplitude obtained from unlabeled MSNs in SNAP25Δ3 mutant mice (blue circles) and WT littermate control mice (open circles) in the presence 200 nm BAC. H, PPR time course summary and averages pre-BAC (gray area) and post-BAC (blue area) at 200 nm. Error bars indicate SEM. *p < 0.05.

