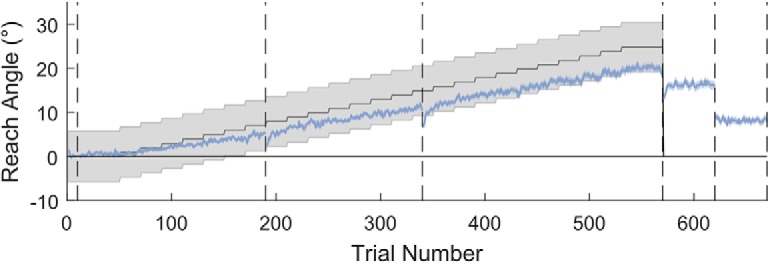
Figure 2.

Reaching performance in the Acquire task. Gray region represents the gradually rotating rewarded region. Blue line indicates mean reach angle for each trial. Shaded blue region represents SEM. Vertical dashed lines indicate different experiment blocks or breaks. Average performance for the full cohort falls within the reward region and demonstrates a clear reduction in reach angle when asked to remove strategy. N = 121.
