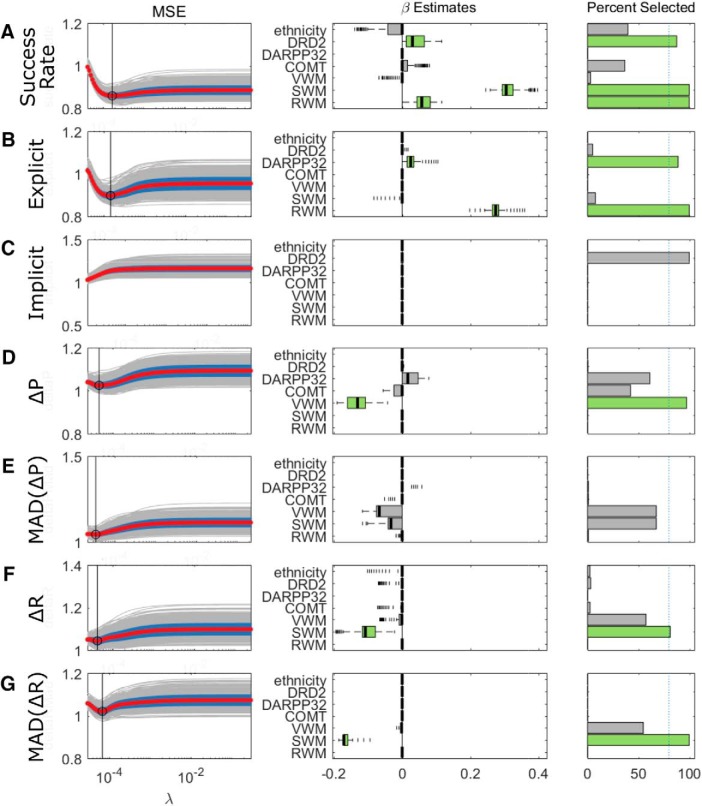
Figure 4.
Lasso regression results for the Acquire task. A–G, Each row represents the results from one outcome variable. Left column represents the MSE as a function of changing the shrinkage parameter λ, with larger values of λ representing greater penalization and sparser models. A minimum in the MSE within its defined boundaries indicates the suitability of that choice of λ (indicated with a vertical line). Given the presence of a minimum, the values of the β for each predictor are taken. We performed 1000 repetitions of the lasso regression for each outcome variable. Middle, Box plots represent the distribution of the coefficient estimates. Rightmost column represents the percentage of times that the individual predictors were assigned nonzero coefficients. We used a threshold of 80% (indicated with a dashed vertical line) to signify that a particular predictor was robustly selected, and these variables are highlighted in green. Median absolute deviation of change in reach angle after rewarded (MAD[ΔR]) and unrewarded (MAD[ΔP]) trials.

