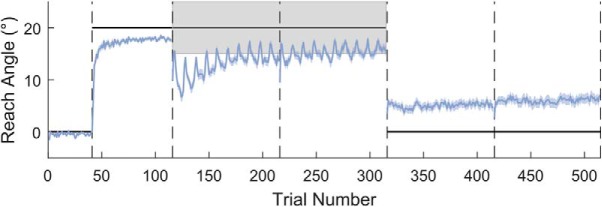
Figure 6.
Reaching performance in the Preserve task. Gray shaded area represents the rewarded region. Thick black line indicates the perturbation. Vertical dashed lines indicate block limits. Blue line indicates mean reach angle for every trial. Blue shaded areas represent SEM. After successfully adapting to the visuomotor rotation, performance deteriorates at the onset of binary feedback; subsequently, SR increases toward the end of the asymptote blocks. Following the removal of all feedback, and the instruction to remove any strategy, a small amount of implicit retention remains. N = 120.

