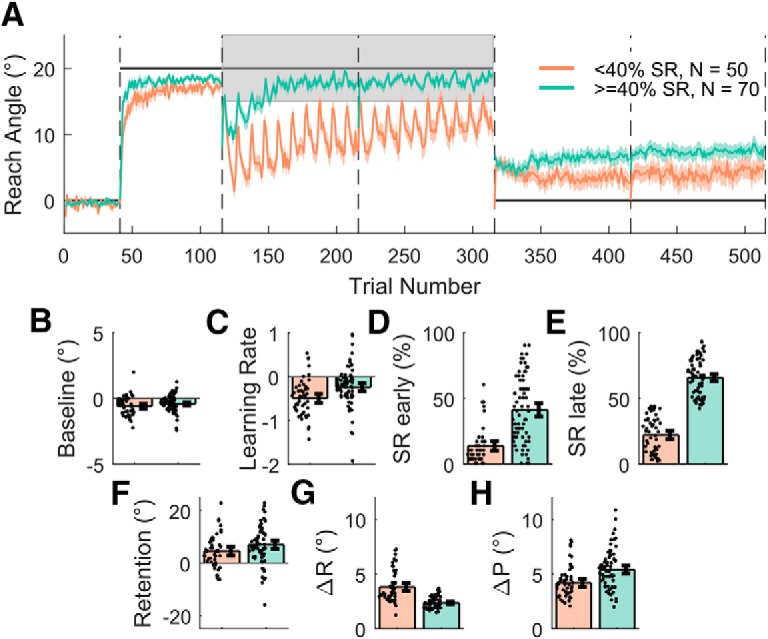
Figure 7.

Preserve task split into two groups on the basis of SR. A, Shaded regions represent SEM. B–H, Derived variables, which acted as outcome variables for the regression analysis, for the two groups. Error bars indicate 95% bootstrapped CIs. Individual data points are displayed.
