Figure 1.
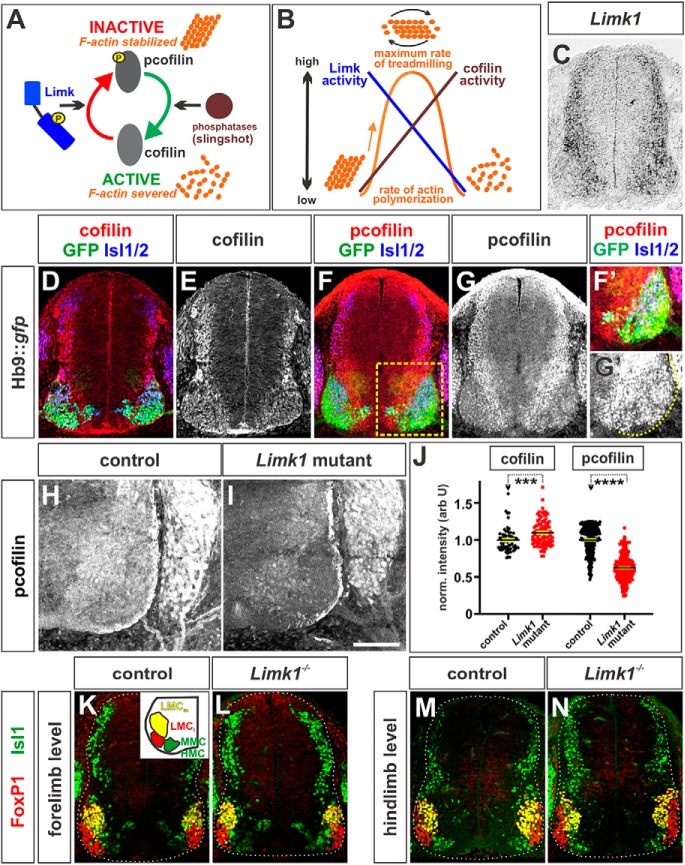
Cofilin activity in spinal MNs during axon extension. A, Cofilin severs actin to produce the actin monomers needed to generate dynamically “treadmilling” filamentous (F) actin. Limk1 phosphorylates, and thereby inactivates, cofilin leading to the stabilization of F-actin. This model has been simplified for clarity (for a review of cofilin regulation, see Bravo-Cordero et al., 2013). B, Idealized model suggesting how the activities of cofilin and Limk control the rate of actin polymerization. Dynamic actin treadmilling occurs when there is a balance between the activities of Limk and cofilin. C, ISH experiments for Limk1 on transverse sections of embryonic day (E) 11.5 brachial mouse spinal cord. Limk1 is expressed broadly in after mitotic spinal neurons, including MNs. D–N, Transverse forelimb (brachial, D–G, H, I, K, L) or hindlimb (lumbar, M, N) sections of E11.5 mouse spinal cord taken from Hb9:gfp (D–G), Limk1+/+ (H, K, M), or Limk1−/− (I, L, N) embryos and labeled with antibodies against total cofilin (D, E), (p)-cofilin (inactive) (red, F, G, H, I), FoxP1 (red, K–N), GFP (green, D, F), Isl1 (green, K–N), and Isl1/2 (blue, D, F). D–G, Both cofilin (D, E) and (p)-cofilin (F, G) are present broadly in after mitotic neurons in the spinal cord. (p)-Cofilin is found at the highest levels in the dorsal neurons and ventral intermediate zone and lower levels in the Hb9+, Isl1/2+ MNs (E). F, Boxed region represents higher confocal gain/offset levels in F′ and G′. H–J, Cofilin is more active in Limk1 mutant motor columns (I) compared with control littermates (H). Quantification of the intensity of cofilin and (p)-cofilin staining (J) demonstrated that Limk1−/− brachial Isl1+ MNs express slightly higher levels of cofilin (n = 51 sections from 2 embryos) and very significantly lower (∼50%) levels of lower (p)-cofilin (n = 26 sections from 4 embryos) compared with than control littermates (cofilin control, n = 33 sections from 2 embryos; probability of similarity between control and mutant, p < 0.0002, Mann–Whitney test; (p)-cofilin control; n = 24 sections from 6 embryos; probability of similarity between control and mutant, p < 0.0001, Mann–Whitney test). For both measurements, the intensity levels were normalized with respect to background. K–N, There were no observable differences between the timing and segregation of the LMC and MMC/HMC motor columns (summarized in K, inset) in control and Limk1 mutant spinal cords. Scale bars: C–E, K–N, 150 μm; F–I, 100 μm. Probability of similarity, ****p < 0.00005; ***p < 0.0005, Mann-Whitney test.

