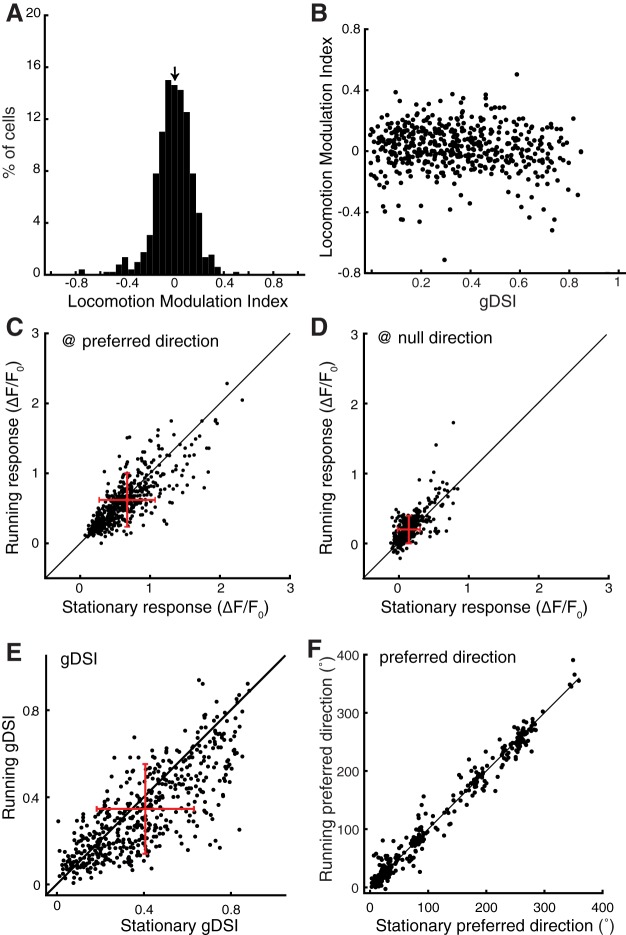
Figure 2.
Quantification of the effect of locomotion on visual responses in the sSGS. A, A histogram of LMI for average responses over the entire tuning curve. The arrow on top of the histogram marks the median value of the distribution (median of LMI = 0.03; n = 528 cells). B, A plot of LMI against gDSI for these cells. C, Comparison of SC neurons' responses at their preferred stimulus direction between running and stationary conditions. D, The same plot for responses at the direction opposite to the preferred direction (“null” direction). E, Comparison of gDSI for individual neurons during running and stationary conditions. F, Comparison of the preferred direction for direction selective cells (gDSI > 0.25 combining both running and stationary conditions). The black lines in C–F indicate the line of equality; the red crosses in C–E indicate the mean and SD of dataset; n = 528 from 12 mice for A–E, n = 360 (gDSI > 0.25) for F.

