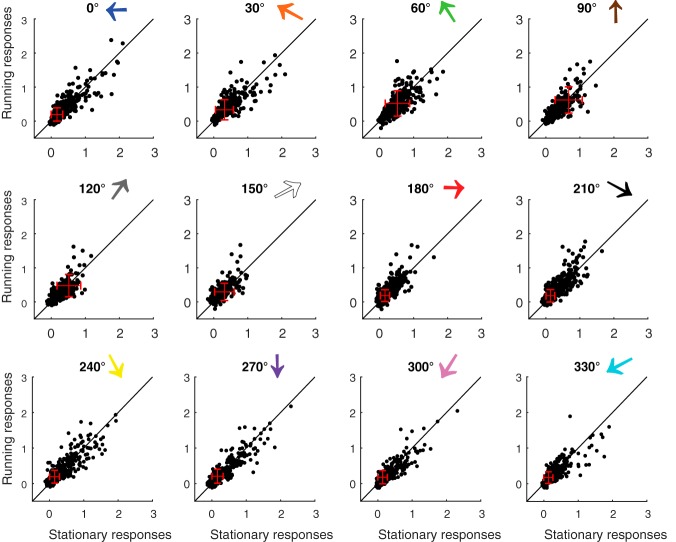
Figure 3.
Comparison of sSGS neurons' responses to each stimulus direction between running and stationary conditions. Each panel plots neurons' responses to a particular stimulus direction under running and stationary conditions. The numbers and colored arrows on top of each plot indicate the stimulus direction, following the same convention as in Figure 1. The black lines indicate the line of equality to help comparison, and the red crosses indicate the mean and SD of each dataset.

