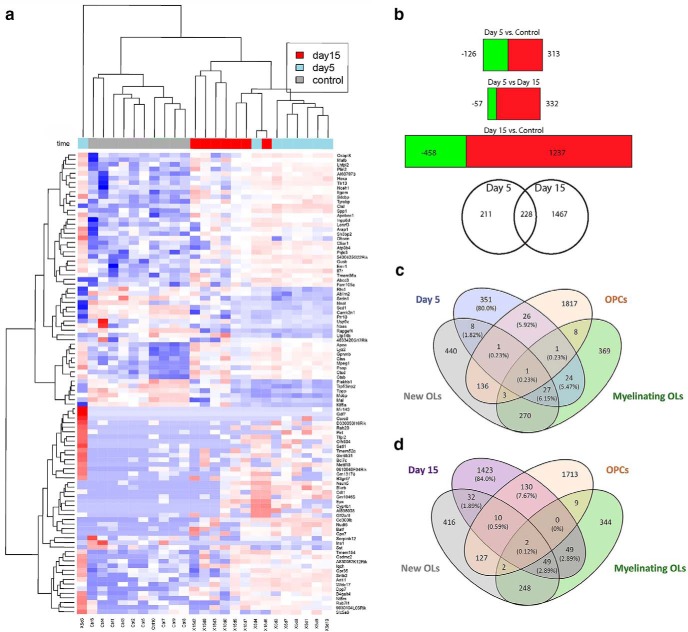
Figure 2.
Transcriptional profile of OPCs responding to white matter stroke. a, Unsupervised clustering of the top 100 genes with highest total gene read counts and differential expression at FDR threshold 0.1 in any comparison. Blue to red represents low to high values (scaled for each row). The 5 and 15 d stroke OPC transcriptomes cluster together and away from the control (nonstroke) OPC transcriptome, except for overlap of 2 cases, indicating that the OPC transcriptional response after stroke is a distinct molecular profile compared with nonstroke OPCs, and is different over time after stroke. b, Differentially expressed genes across comparisons with FDR < 0.1. Green represents downregulated and red represents upregulated for each corresponding condition Venn diagram of differentially expressed genes in day 5 and day 15. The differentially expressed genes are listed in Table 1-1. c, d, Comparison of stroke OPC transcriptomes at day 5 and 15 with published transcriptomes from OLs and OPCs (Zhang et al., 2014). There is not substantial overlap of the 5 d stroke OPC transcriptomes with control (nonstroke) OPCs, new oligos, or myelinating oligos and that that that this overlap does not increase, even with time and the limited differentiation that occurs in OPC after stroke, as seen in the 15 d stroke OPC transcriptome. Additional comparisons to published OPC transcriptomes are in Table 1-2.

