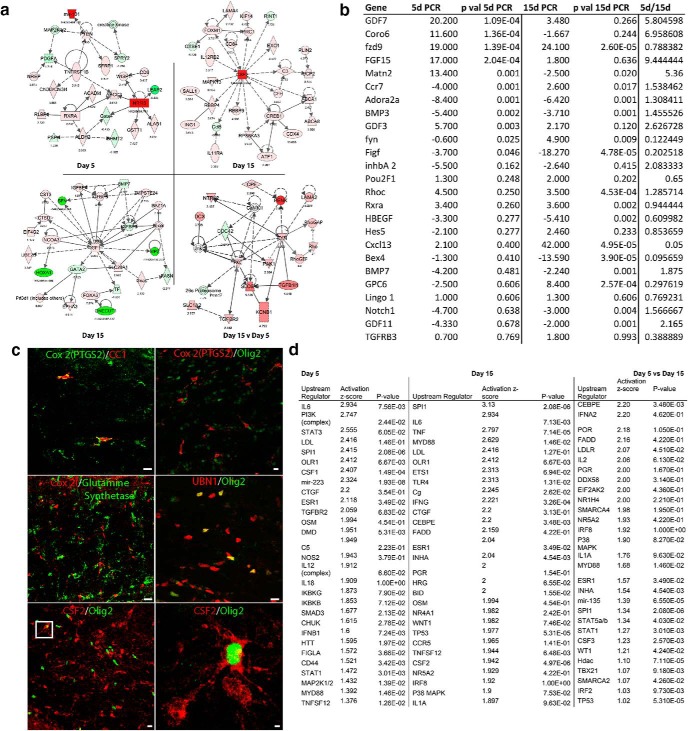
Figure 3.
Analysis of stroke OPC transcriptome. a, Molecular pathway analysis of differentially regulated genes in 5 d, 15 d, 15 d versus 5 d stroke OPC transcriptomes. All genes are FDR ≤ 0.1. Red represents upregulation. Green represents downregulation. The fold change (log2) for each gene is indicated below the gene symbol. Several genes are hubs in their links within these networks, such as RXRa and PTEN in day 5, CSF2, and IGF1 in day 15, and Fyn and PKC in day 15 versus day 5. Dotted lines indicate indirect relationship, in which an association is reported in the literature but not a mechanistic role. b, Confirmatory qPCR analysis of select differentially regulated genes from RNAseq dataset of 5 and 15 d stroke OPC transcriptomes; 5 and 15 d qPCR columns show fold change relative to expression of that gene in control (nonstroke) subcortical white matter OPCs. p value columns are two-tailed t test comparisons between 5 or 15 d versus control. c, Immunohistochemical staining for Cox2 (PTGS1), UBN1, and CSF2 15 d after stroke. Cox2 colocalization with markers of OL-lineage cells (Olig2) and mature OLs (CC1) and Cox2 colocalization with a marker of mature astrocytes (glutamine synthetase). UBN1 colocalization with Olig2. CSF2/Olig 2 and overlap in the same microscopic field. The box in the overlap image is enlarged in the rightmost panel. Scale bar, 20 μm. d, List of most significantly associated upstream regulators that are predicted to induce genes in the day 5 and day 15 OPC stroke transcriptomes, and that would induce genes that are significantly different in day 5 to day 15. p value is Fisher's exact test and indicates that a given upstream regulators has a significant predicted interaction with the transcriptome. The activation score indicates the strength of the induction or inhibition of a set of downstream genes from a particular upstream regulator.

