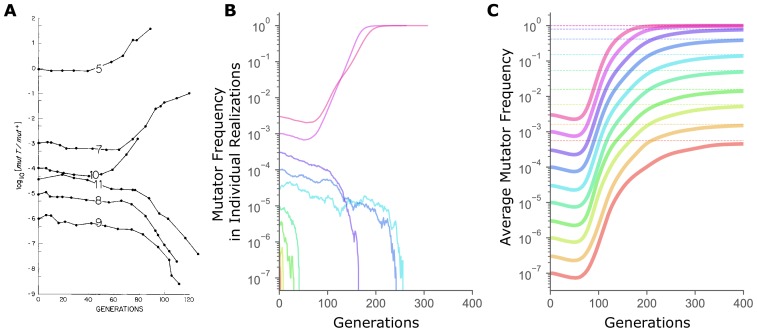
Figure 1. The sharp transition between fixation and loss in mutator dynamics at different starting frequencies is due to limited sampling.
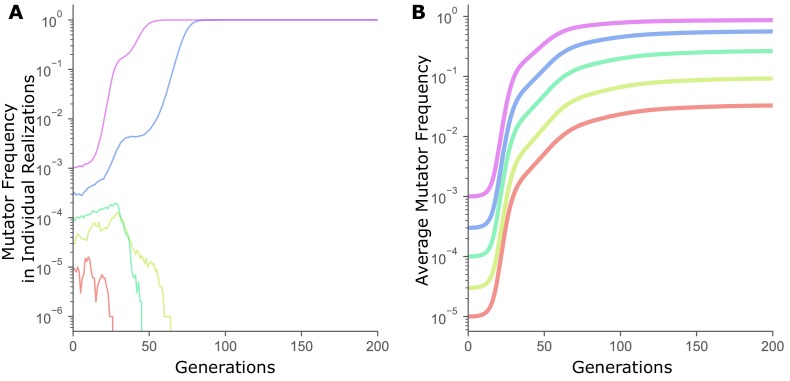
(A) Changes in the ratio of the mutator and the wild-type alleles of the E. coli mutT locus over time in continuous chemostat cultures. (Figure 1 from Chao and Cox, 1983). (B) In simulations, mutator trajectories in individual realizations initiated at different starting frequencies recapitulate the experimental observation of the frequency-threshold for mutator hitchhiking. Parameter values used are typical of microbial experimental populations (Raynes et al., 2018): N = 107, Udel = 10−4, Uben = 10−6, constant sben = 0.1, constant sdel = -0.1. Mutators mutate 100× faster than non-mutators. (C) Average mutator trajectories across realizations do not show evidence of the frequency-threshold. On average, mutators increase in frequency at all , showing that selection favors mutators independent of frequency. Average mutator frequency always eventually reaches the expected (dashed horizontal lines) calculated in Figure 2. Mutator frequencies averaged across 106 simulation runs at = 10−7 and = 3×10⁻⁷, and across 105 simulation runs for all other starting frequencies. For simulations with exponentially distributed selection coefficients see Figure 1—figure supplement 1.
© 1983 John Wiley and Sons. All Rights Reserved
Figure 1 reproduced from Chao and Cox, 1983 with permission.


