. 2019 Oct 31;8:e52654. doi: 10.7554/eLife.52654

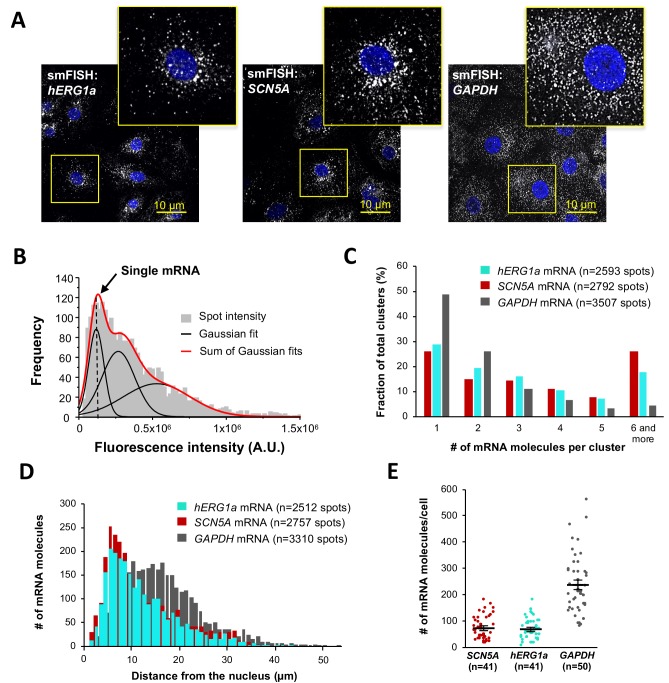
Figure 2. Quantitative description of single hERG1a and SCN5A transcripts and their distribution in iPSC-CMs.

(A) Representative confocal images and enlargement (outlined in yellow) of iPSC-CMs subjected to the smFISH protocol. (B) By fitting the intensity histogram of smFISH signals (n = 2611 spots) to the sum of Gaussian functions (red line), the typical intensity corresponding to a single mRNA molecule (vertical dashed line) was extracted. (C) The distribution of the number of mRNA molecules associated in clusters for each transcript evaluated by smFISH. (D) Histogram showing the cytoplasmic distribution of mRNA signals with distance from the nucleus. (E) The number of mRNAs detected per cell was plotted for SCN5A, hERG1a and GAPDH (lines represent mean ±SE).

Figure 2—source data 1. Intensities plot for determination of single mRNA intensity raw data for Figure 2B.
DOI: 10.7554/eLife.52654.010
Figure 2—source data 2. Clusterization of transcripts raw data for Figure 2C.
DOI: 10.7554/eLife.52654.011
Figure 2—source data 3. Distance of mRNA from the nucleus raw data for Figure 2D.
elife-52654-fig2-data3.xlsx (170.2KB, xlsx)
DOI: 10.7554/eLife.52654.012
Figure 2—source data 4. Numbers of mRNA per cells raw data for Figure 2E.
DOI: 10.7554/eLife.52654.013

Figure 2.

Figure 2—figure supplement 1. Specificity of the probes used in smFISH experiments.

Figure 2—figure supplement 1.

Representative images of smFISH for either hERG1a (top panel) or SCN5A (bottom panel) mRNAs performed in HEK293 cells transiently transfected with hERG1a or SCN5A. Only the cells expressing hERG1a or SCN5A showed a positive signal for smFISH revealing the specificity of the probes used in smFISH experiments.
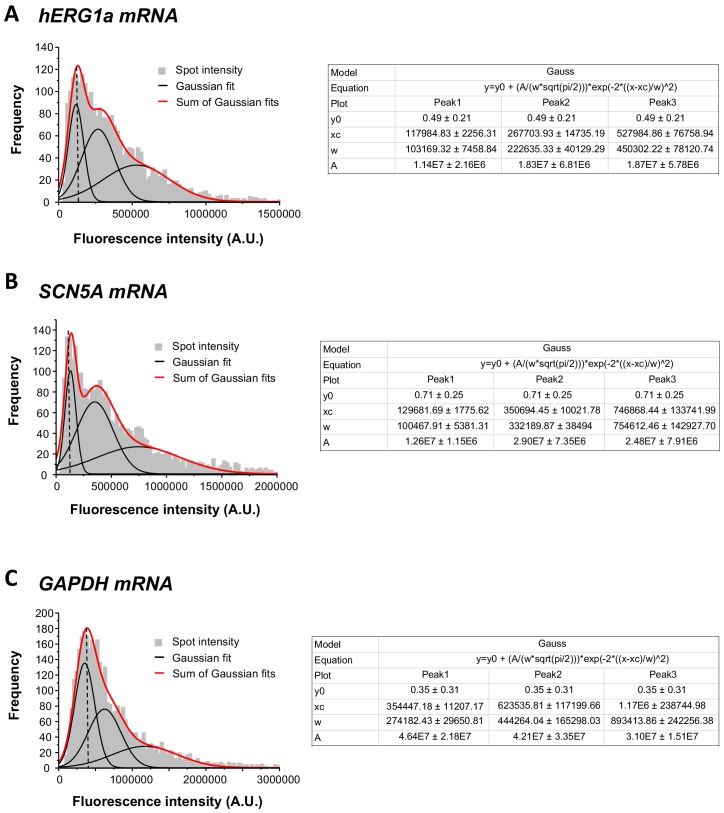
Figure 2—figure supplement 2. Single mRNA intensity determination.

Figure 2—figure supplement 2.

The distribution of total fluorescence intensity of smFISH signals for hERG1a (2611 spots; A), SCN5A (2815 spots; B), and GAPDH (3507 spots; c). By fitting the histogram to the sum of Gaussian functions (red line), the typical intensity corresponding to a single mRNA molecule (vertical dashed line) was extracted.
Figure 2—figure supplement 2—source data 1. Single mRNA intensity determination for Figure 2—figure supplement 2.
DOI: 10.7554/eLife.52654.008
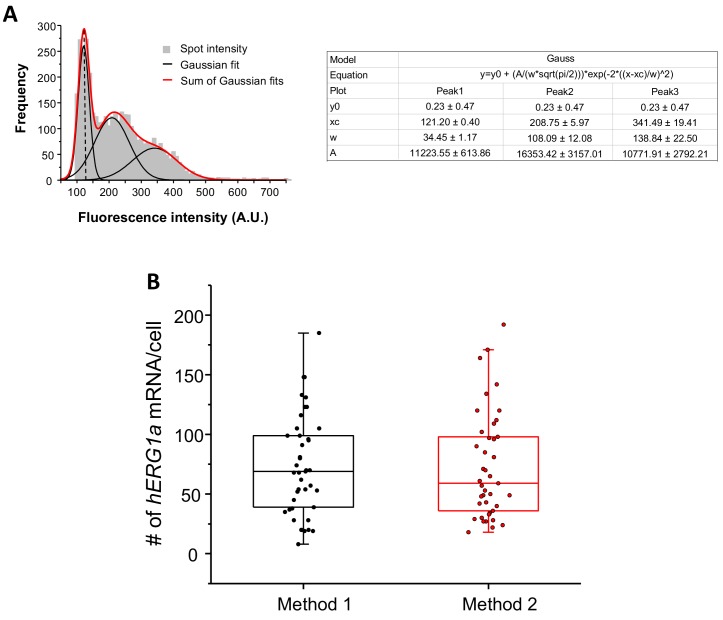
Figure 2—figure supplement 3. Quantification of mRNA expression using two different methods.

Figure 2—figure supplement 3.

(A) The distribution of total fluorescence intensity of smFISH signals for hERG1a (2892 spots) obtained using FISHQUANT software for analysis. By fitting the histogram to the sum of Gaussian functions (red line), the typical intensity corresponding to a single mRNA molecule (vertical dashed line) was extracted. (B) Comparison of the number of mRNA molecules detected per cells for hERG1a using two different methods of analysis (Method 1: manual using ImageJ; Method 2: Semi-automatic using FISHQUANT).