. 2019 Oct 31;8:e52654. doi: 10.7554/eLife.52654

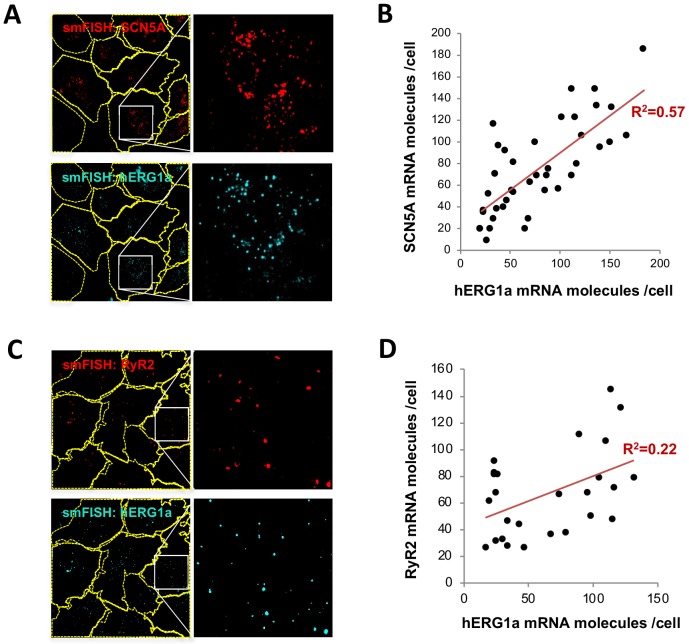
Figure 3. hERG1a and SCN5A transcript expression levels correlate.

(A) Representative confocal images and enlargements of double smFISH experiments for SCN5A (red) and hERG1a (cyan) mRNAs. (B) The number of mRNA molecules detected per cell in double smFISH experiments were plotted for SCN5A and hERG1a and the coefficient of determination R2 was determined from the Pearson’s correlation coefficient R (n = 41 cells; N = 2). (C) Representative confocal images and enlargements of double smFISH experiments for RyR2 (red) and hERG1a (cyan) mRNAs. (D) The number of hERG1a mRNA was plotted against the number of RYR2 mRNAs per cells and showed a low correlation in their expression (n = 26 cells; N = 2).

Figure 3—source data 1. Correlation analysis of hERG1a and SCN5A mRNA expressions raw data for Figure 3B.
DOI: 10.7554/eLife.52654.017
Figure 3—source data 2. Correlation analysis of hERG1a and RyR2 mRNA expressions raw data for Figure 3D.
DOI: 10.7554/eLife.52654.018

Figure 3.

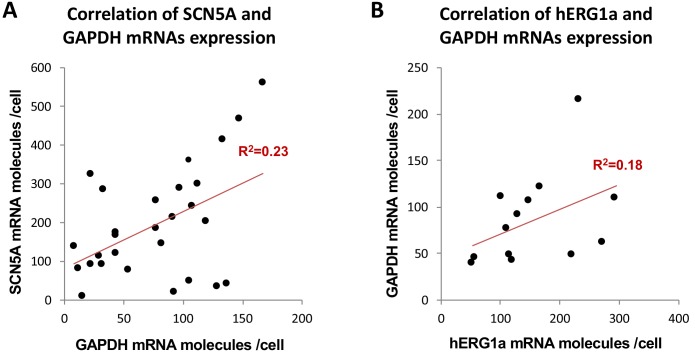
Figure 3—figure supplement 1. Correlation of mRNA expression.

Figure 3—figure supplement 1.

The number of mRNA molecules detected per cells in double smFISH experiments were plotted for SCN5A and GAPDH (28 cells, (A), and hERG1a and GAPDH (13 cells, (B). The Pearson’s correlation coefficient (R2) were calculated for each pairs of mRNAs.
Figure 3—figure supplement 1—source data 1. Correlation of mRNA expression for Figure 3—figure supplement 1.
DOI: 10.7554/eLife.52654.016