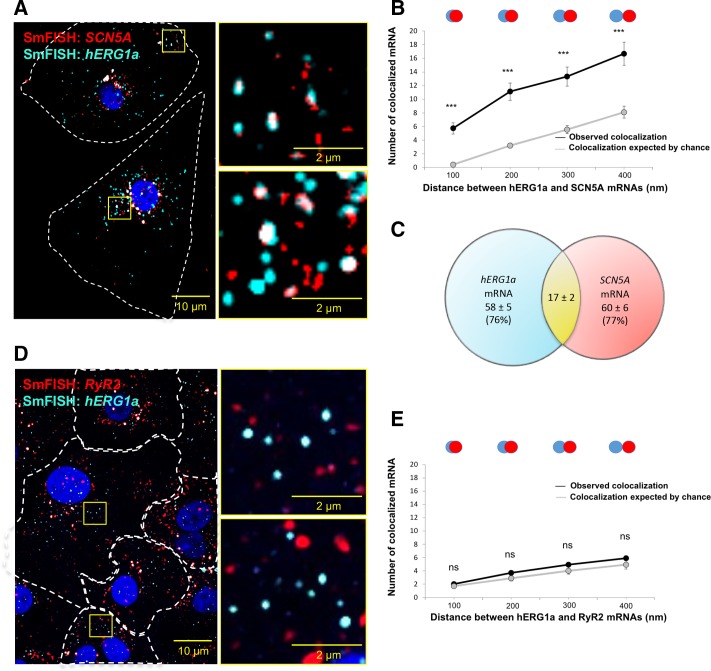
Figure 4. hERG1a and SCN5a transcript colocalization.
(A) Representative confocal images and enlargement (outlined in yellow) of iPSC-CMs subjected to smFISH showing the colocalization of hERG1a and SCN5A mRNAs. (B) Comparison of the average number of associated hERG1a and SCN5A mRNAs particles observed vs. expected by chance using different overlap criteria illustrated (mean ±SE; n = 41 cells; N = 2). (C) Diagram illustrating that the association of hERG1a and SCN5A mRNAs account for 24% and 23% of their total population respectively. (D) Representative confocal images of smFISH for hERG1a and RyR2 transcripts. (E) Comparison of the average number of associated hERG1a and RyR2 mRNAs particles observed vs. expected by chance using different overlap criteria (mean ±SE; n = 26 cells; N = 2).

