. 2019 Oct 31;8:e52654. doi: 10.7554/eLife.52654

Figure 5. Cotranslational association of hERG1a protein and hERG1a and SCN5A mRNAs.

(A) Representative confocal images and enlargement of iPSC-CMs subjected to immunofluorescence (IF) combined with smFISH protocol. Arrows indicate triply colocalized particles. (B) The average number of particles comprising hERG1a and SCN5A mRNAs and hERG1a protein per cell compared to the expected number based on chance using a maximum distance of 2 pixels between center of mass (minimum 50% overlap; mean ±SE; n = 13 cells, N = 2). (C) Histogram showing that 16% of hERG1a mRNA associate with hERG1a protein (actively translated population); of that percentage, 46% also interact with SCN5A transcripts (mean ±SE; n = 13 cells; N = 2). (D) Histogram showing the distribution of colocalized mRNA spots through the cytoplasm and from the nucleus revealing that RNP complexes are mostly localized within 10 µm from the nucleus. In the top right corner, representative examples of colocalized spots (yellow circles) and analysis of distance from the nucleus (white dashed arrows).

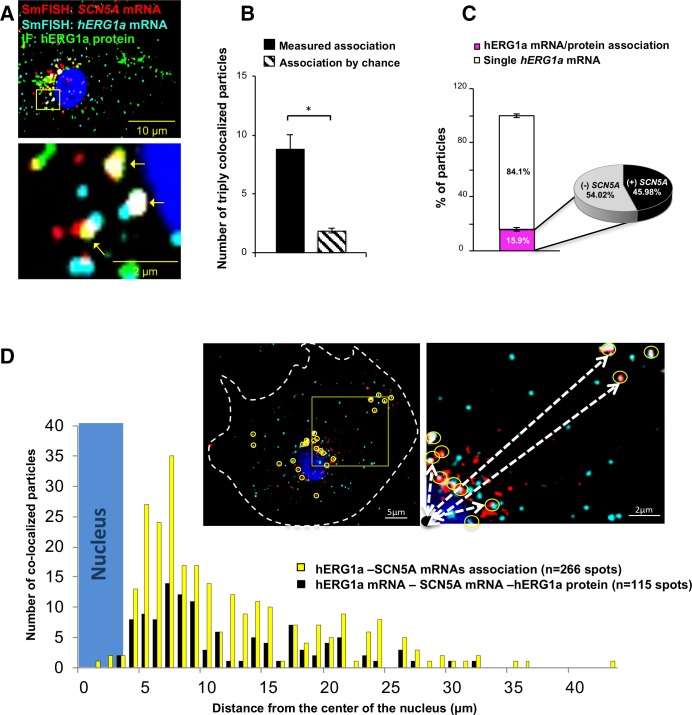
Figure 5—source data 1. Association of hERG1a and SCN5A mRNAs with hERG1a protein raw data for Figure 5B.
DOI: 10.7554/eLife.52654.026
Figure 5—source data 2. Proportion of co-translational association raw data for Figure 5C.
DOI: 10.7554/eLife.52654.027
Figure 5—source data 3. Distribution of associated mRNAs raw data for Figure 5D.
DOI: 10.7554/eLife.52654.028

Figure 5.

Figure 5—figure supplement 1. hERG1a mRNA protein interaction.

Figure 5—figure supplement 1.

(A) Representative confocal images and enlargement (outlined in yellow) of iPSC-CMs subjected to Immunofluorescence combined with smFISH protocol showing the colocalization (yellow arrows) of hERG1a mRNA (magenta) and hERG1a protein (green). (B) Pie chart showing the percentage of hERG1a mRNA population interacting with hERG1a protein revealing that 16% of hERG1a mRNA were actively translated at the moment of fixation.
Figure 5—figure supplement 1—source data 1. Association of hERG1a and SCN5A mRNAs with hERG1a protein raw data for Figure 5—figure supplement 1.
DOI: 10.7554/eLife.52654.025