. 2019 Oct 31;8:e52654. doi: 10.7554/eLife.52654

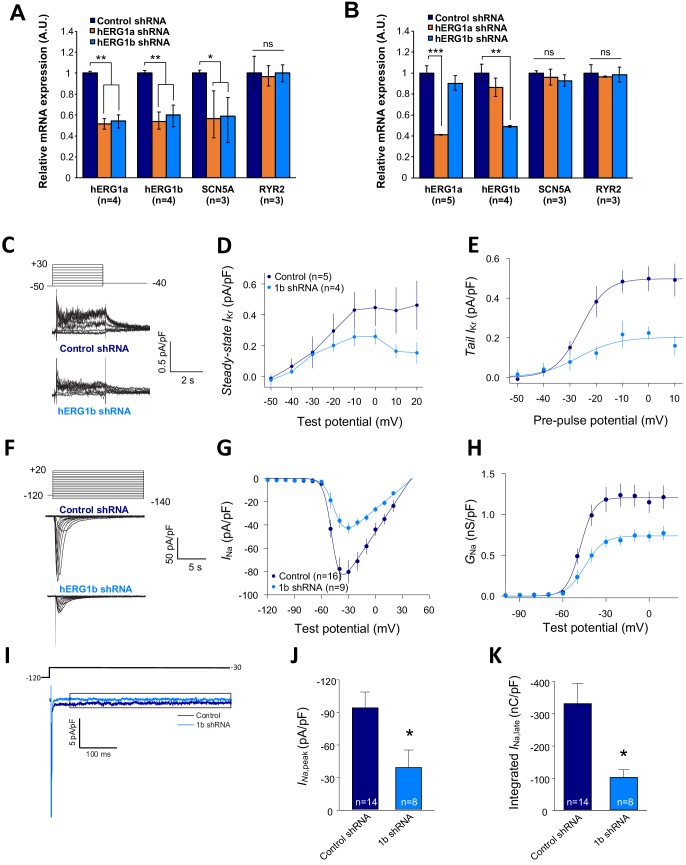
Figure 7. Co-knockdown of IKr and INa by hERG transcript-specific shRNA.

(A) Effects of hERG1a or hERG1b silencing on channel mRNA expression levels detected by RT-qPCR (mean ±95% CI) in iPSC-CMs. A non-targeting shRNA (scrambled shRNA) is used as a control. (B) Effects of specific hERG1a or hERG1b silencing on ion channel mRNAs expressed alone in HEK293 cells. (C) Representative family of traces show IKr in presence of control (upper) or hERG1b shRNA (lower). (D) Summary of steady-state current density vs. test potential shows effect of hERG1b shRNA (mean ±SE). (E) Effects of 1b shRNA on peak tail current vs. pre-pulse potential (mean ±SE). (F) Representative family of traces recorded from iPSC-CMs showing effects of hERG1b-specific shRNA compared to control shRNA on peak INa. (G) Summary current-voltage plot of peak INa vs. test potential (mean ±SE). (H) Summary conductance (G)-voltage plot based on data from G (mean ±SE). (I) Late sodium current representative trace in control and 1b shRNA-transfected cells, measured by applying a single pulse protocol of 800 ms. (J) Summary statistics of peak INa showed a decrease upon transfection with hERG1b shRNA (mean ±SE). (K) Late INa measured as the integral from 50 to 800 ms from the beginning of the pulse showed a decrease upon transfection with hERG1b shRNA (mean ±SE).

Figure 7—source data 1. Co-knockdown of transcripts by qPCR raw data for Figure 7A.
DOI: 10.7554/eLife.52654.036
Figure 7—source data 2. Specificity of shRNA raw data for Figure 7B.
DOI: 10.7554/eLife.52654.037
Figure 7—source data 3. IKr is reduced upon hERG silencing raw data for Figure 7D–E.
DOI: 10.7554/eLife.52654.038
Figure 7—source data 4. Reduction of peak INa after hERG silencing raw data for Figure 7G–H.
DOI: 10.7554/eLife.52654.039
Figure 7—source data 5. Decrease of INa,late current upon hERG silencing raw data for Figure 7J–K.
DOI: 10.7554/eLife.52654.040

Figure 7.

Figure 7—figure supplement 1. Co-knockdown of hERG and SCN5A mRNAs by hERG transcript-specific shRNA.

Figure 7—figure supplement 1.

(A) Representative confocal images of smFISH for hERG1a and SCN5A transcripts in iPSC-CMs transfected with either a control or hERG1b shRNA. (B) Histogram of the average number of transcripts detected per cell for hERG1a or SCN5A transcripts in presence of hERG1b shRNA compared to a scrambled shRNA (mean ±SE). (C) Histogram of the mean number of hERG1a transcript colocalized with SCN5A transcript in cells silenced for hERG1b compared with control (mean ±SE).
Figure 7—figure supplement 1—source data 1. Co-knockdown of hERG and SCN5A by hERG transcript-specific shRNA for Figure 7—figure supplement 1.
DOI: 10.7554/eLife.52654.035