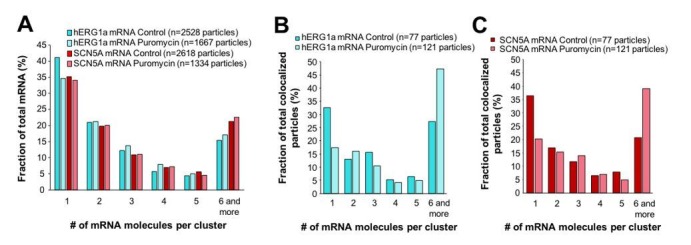
Author response image 2. Effect of puromycin on hERG and SCN5A cluster distribution.

(A) The distribution of the number of mRNA molecules associated in clusters for each transcript evaluated by smFISH in presence or absence (control) of puromycin. (B) Histogram showing the distribution of colocalized particles in clusters as a fraction of total hERG colocalized particles with or without puromycin treatment. (C) Histogram showing the distribution of colocalized particles in clusters as a fraction of total SCN5A colocalized particles with or without puromycin treatment.
