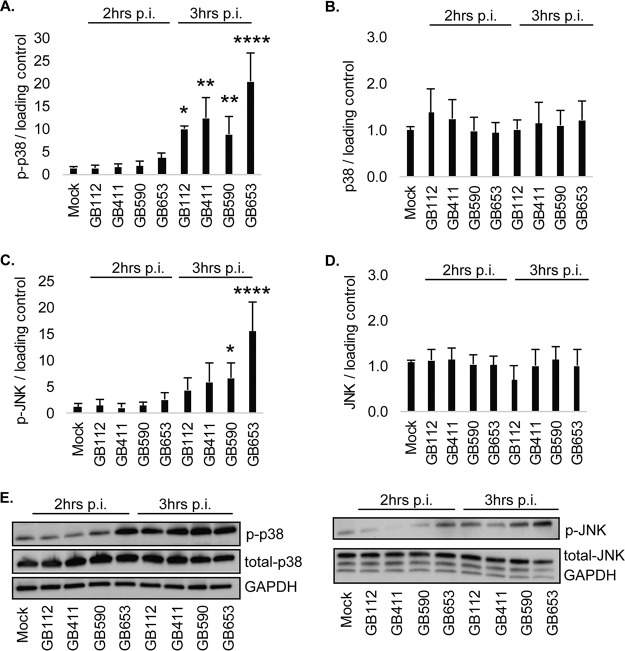
FIG 1.
GBS induces strain-specific activation of stress-responsive MAPKs. T-HESCs were infected with GBS for 2 or 3 h (MOI = 10), and host cell lysates were collected for Western blotting. Lysates were assessed for phosphorylated (active) or total protein levels of p38 (A and B) and JNK (C and D), and densitometry was used to compare differences between infection conditions. Densitometry values represent pooled results from at least three independent biological replicates, and error bars represent standard deviations of the means. Significance was determined by ANOVA (p-p38, P < 0.0001; p38, P = 0.8053; p-JNK, P < 0.0001; JNK, P = 0.4604; p-ERK1/2, P = 0.9963; ERK1/2, P = 0.6838) with post hoc Dunnett’s testing to compare each infection condition to the mock infection. *, P < 0.05; **, P < 0.01; ****, P < 0.0001. (E) Representative Western blots from one biological replicate with its corresponding loading control (GAPDH) are shown. Equal amounts of the same protein lysate preparations were loaded onto the gels for each protein.

