
FIG 10.
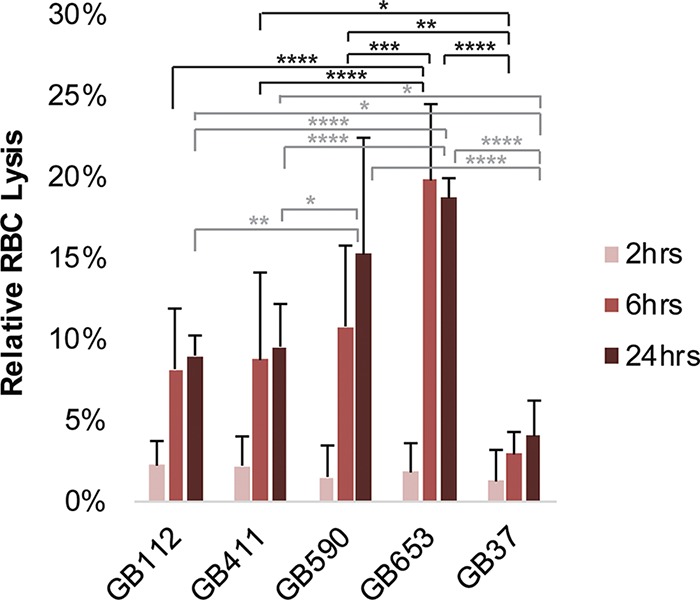
GBS strains exhibit differential hemolytic activity. The upper and lower limits of RBC lysis were determined by using the detergent Triton X-100 as a positive control and PBS as a negative control; percent RBC lysis was determined relative to these values. Three biological replicates were averaged for each condition (each performed in technical triplicates), and error bars represent standard deviations of the means. Significance was determined by ANOVA for each time point (2 h, P = 0.7442; 6 h, P < 0.0001; 24 h, P < 0.0001), and Tukey’s tests were performed post hoc to determine differences in RBC lysis between treatments for each time point. No significant differences were observed at 2 h; significant differences at 6 h are indicated in black, while significant differences at 24 h are indicated in gray. *, P < 0.05; **, P < 0.01; ***, P < 0.001; ****, P < 0.0001.