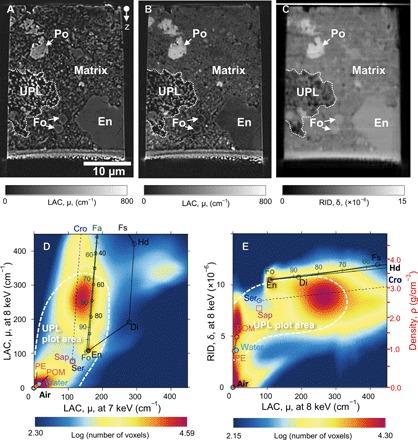
Fig. 1. XCT slice images of equant samples of the Acfer 094 matrix and their 2D histograms of LAC and RID values at 7 and 8 keV.

Absorption XCT images at 7 keV (A) and 8 keV (B), as well as a phase XCT image at 8 keV (C), indicate an UPL embedded in the matrix. 2D histograms of LAC values at 7 and 8 keV (D) and LAC and RID values at 8 keV (E) of the matrix show peaks around the air, resin [polyacetal (POM)], forsterite (Fo), enstatite (En), and serpentine/saponite (Serp/Sap)–cronstedtite (Cro). Those plots of UPL have peaks in the areas surrounded by white dashed lines in (D) and (E). The density scale corresponding to the RID values is shown in (E). Fa, fayalite; Di, diopside; Hd, hedenbergite; Fs, ferrosilite; Po, pyrrhotite; PE, polyethylene.
