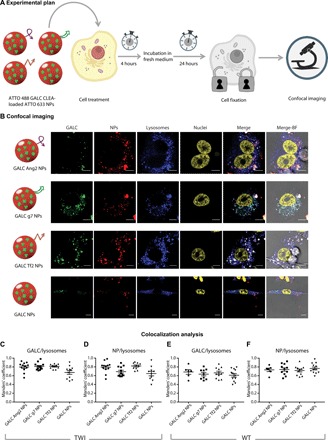
Fig. 2. Intracellular localization of targeted GALC CLEA NPs.

(A) Graphical summary of the experiment. TWI or WT primary fibroblasts were incubated with fluorescently labeled ATTO 488 GALC CLEA-loaded ATTO 633 NPs for 4 hours and then washed and added with fresh medium. After 24 hours, cell lysosomes were stained, and cells were fixed and imaged with a confocal microscope. (B) Confocal imaging. Representative confocal images of TWI fibroblasts treated with fluorescently labeled GALC Ang2 NPs, GALC g7 NPs, GALC Tf2 NPs, or GALC NPs. From the left to the right column: GALC (green, stained with ATTO 488), NPs (red, stained with ATTO 633), lysosomes (blue, stained with LysoTracker Red DND-99), nuclei (yellow, stained with DAPI), superimposition of GALC, NPs, lysosomes, and nuclei fluorescence and superimposition of all channels with bright-field (BF) images. Scale bars, 10 μm. (C and D) Colocalization analysis. Manders’ coefficient of GALC/lysosomes and NPs/lysosomes overlap in TWI cells treated with GALC CLEA NPs. (E and F) Manders’ coefficient of GALC/lysosomes and NPs/lysosomes overlap in WT cells treated with GALC CLEA NPs.
