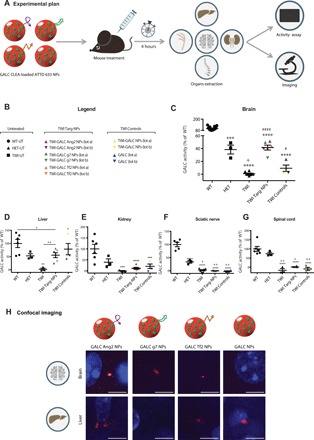
Fig. 5. In vivo NP mediated ERT in the TWI mice.

(A) Graphical summary of the experiment. TWI mice were treated with targeted GALC CLEA ATTO 633 NPs (GALC Ang2 NPs, GALC g7 NPs, or GALC Tf2 NPs), nontargeted GALC CLEA ATTO 633 NPs (GALC CLEA NPs), or with the free rm-GALC (GALC). Four hours later mice were euthanized, and GALC activity was assayed in extracted brain, sciatic nerves, spinal cord, kidneys, and liver by HMU-βGal assay. (B) Legend. Untreated: WT (WT-UT), heterozygous (HET-UT), and TWI (TWI-UT). Targeted GALC CLEA ATTO 633 NPs (TWI Targ-NPs): TWI-GALC Ang2 NPs (lot a and lot b), TWI-GALC g7 NPs (lot a and lot b), and TWI-GALC Tf2 NPs (lot a and lot b). Control treatments (TWI Controls): GALC CLEA ATTO 633 NPs (TWI-GALC NPs lot a and lot b) and free rm-GALC (GALC-lot a and lot b). (C) Brain GALC activity. ***P < 0.001 HET versus WT; ****P < 0.0001 TWI, TWI Targ-NPs, and TWI Controls versus WT; +P < 0.05 TWI versus HET; #P < 0.05 TWI Controls versus TWI; ####P < 0.0001 TWI Targ-NPs versus TWI one-way ANOVA (Tukey’s test). Means ± SEM (n = 3 to 12 per group). (D) Liver GALC activity. **P < 0.01 TWI versus WT and #P < 0.05 TWI Controls versus TWI, one-way ANOVA (Tukey’s test). ^P < 0.05 TWI Targ-NPs versus WT and ^^P < 0.01 TWI Targ-NPs versus TWI, Student’s t test. Means ± SEM (n = 3 to 6 per group). (E) Kidney GALC activity. ***P < 0.001 TWI and TWI Controls versus WT and ****P < 0.0001 TWI Targ-NPs versus WT, one-way ANOVA (Tukey’s test). Means ± SEM (n = 3 to 6 per group). (F) Sciatic nerve GALC activity. Results are expressed in unit per microgram and reported as percentage of the WT activity (U/μg = unit of enzyme per microgram of cell lysate). ****P < 0.0001 all groups versus WT, +P < 0.05 TWI versus HET, ++P < 0.01 WT, TWI Targ-NPs and TWI Controls versus HET, one-way ANOVA (Tukey’s test). Means ± SEM (n = 3 to 8 per group). (G) Spinal cord GALC activity. ****P < 0.0001 HET, TWI Targ-NPs and TWI Controls versus WT, +P < 0.05 TWI Targ-NPs versus HET, and ++P < 0.01 TWI and TWI Controls versus HET, one-way ANOVA (Tukey’s test). Means ± SEM (n = 3 to 7 per group). (C to G) Results are expressed in unit per microgram and reported in percentage of the WT activity (U/μg = unit of enzyme per microgram of cell lysate). (H) Confocal imaging. Representative confocal images of brains and livers of the treated TWI mice. NPs are shown in red in the brains of the mice administered with the functionalized targeted GALC CLEA ATTO 633 NPs (GALC Ang2 NPs, GALC g7 NPs, or GALC Tf2 NPs), while they are not present in the brain of the mice treated with the nontargeted GALC CLEA ATTO 633 NPs (GALC CLEA NPs). All livers present NPs. Scale bars, 5 μm.
