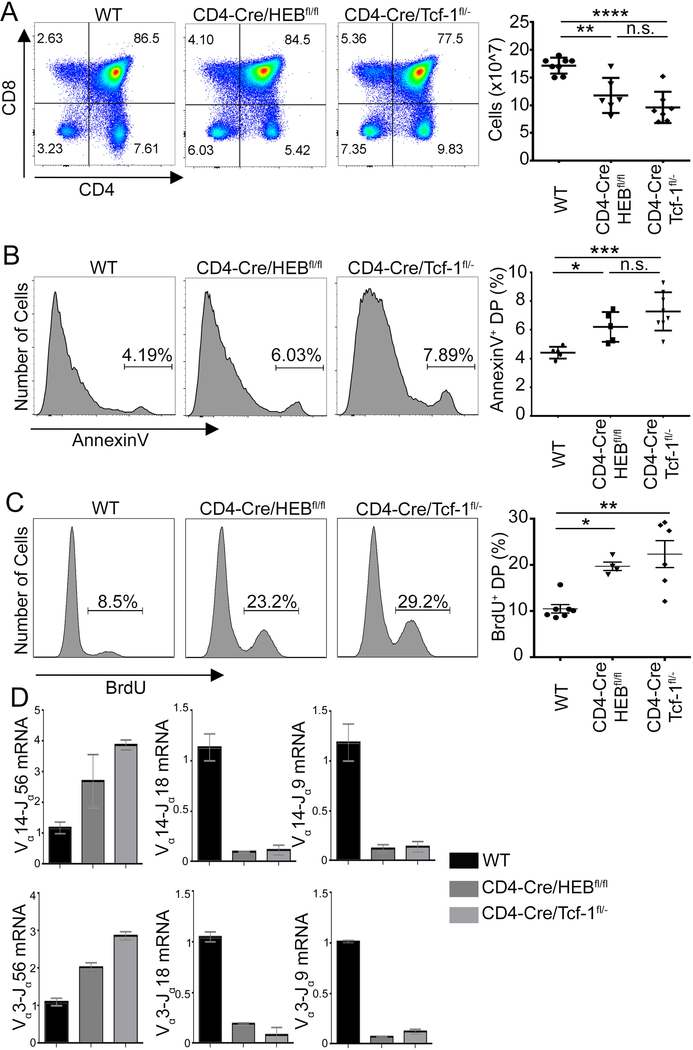
Figure 3: Tcf-1 or HEB Deficiency Elicits Similar Developmental Impairments.
A. FACS plots of CD4 versus CD8 staining in WT (CD4Cre), CD4-Cre/HEBfl/fl and CD4-Cre/Tcf-1fl/- thymocytes from 6–8 week old mice. (Right) Thymocyte numbers from the indicated mouse strains (n=6–8) (**=p≤0.01, ****= p≤0.0001). B. Histogram plots of Annexin V staining of gated DPs in the indicated mouse strains. (Right) Cumulative plots of the fraction of Annexin V+ DPs in the indicated mouse strains (n=5–8). (*=p≤0.05, ****= p≤0.0001). C. Histogram plots of BrdU staining in gated DPs in the indicated mouse strains. Cumulative plots of the fraction of BrdU+ DPs. (*=p≤0.05, **=p≤0.01). D. Quantitative PCR analysis of transcripts of Vα14 and Vα3 rearrangements to Jα56, Jα18 or Jα9 segments in sorted DPs relative to the expression of Cα transcripts. Data are representative of two experiments, shown as mean with s.e.m. All P-values were determined by Ordinary one-way Anova.

