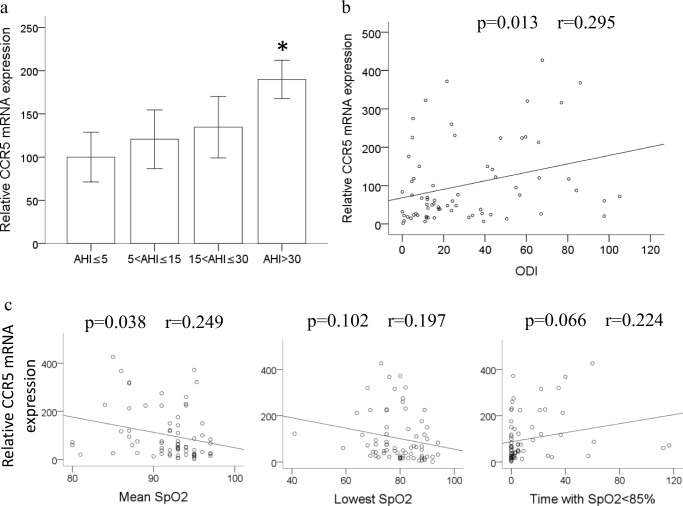
Fig. 5.
CCR5 mRNA expression increased in monocytes of OSA patients. a The CCR5 mRNA expression of 72 patients from four groups with different OSA severity was analyzed by RT/real-time PCR. (Data are presented as mean ± SEM, *p < 0.05 vs. AHI ≤ 5.) b Linear regression demonstrated the positive correlation between ODI and CCR5 mRNA expression levels in monocytes (p = 0.013, r = 0.295). c Linear regression demonstrated the positive correlation between CCR5 mRNA expression levels in monocytes and mean SpO2 (p = 0.038, r = 0.249), but not lowest SpO2 or time with SpO2 < 85%

