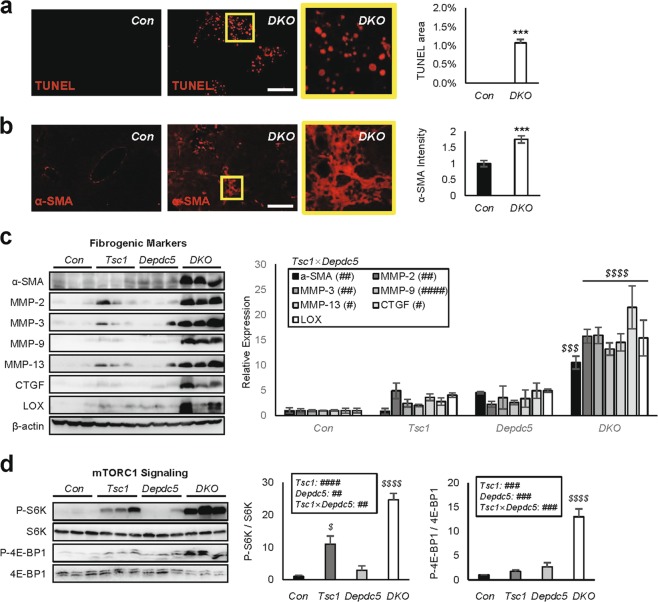
Fig. 3. Depdc5/Tsc1 double knockout (DKO) livers upregulate fibrosis and mTORC1 signaling.
Mouse cohort described in Fig. 2 was subjected to histology a, b and immunoblotting c, d as outlined below. a TUNEL staining of liver sections. Boxed area is magnified in right panel. TUNEL-positive areas were quantified. b Liver sections were subjected to α-SMA staining. Boxed area was magnified in right panel. α-SMA staining intensities were quantified. c From the liver lysates, fibrogenic marker expression was analyzed through immunoblotting. Band intensities were quantified (n = 3). d From the liver lysates, phosphorylation of mTORC1 substrates were analyzed through immunoblotting. Band intensities were quantified (n = 3, mean ± SEM). Data are shown as mean ± SEM. ***P < 0.001 (Student’s t-test). Effects of Tsc1 and Depdc5 mutations and their interaction (Tsc1 × Depdc5) were assessed through two-way ANOVA (#P < 0.05; ##P < 0.01; ###P < 0.001; ####P < 0.0001), and statistical significance between Con and indicated groups were assessed through Tukey’s multiple comparison test ($P < 0.05; $$$P < 0.001; $$$$P < 0.0001). Scale bars, 200 µm

