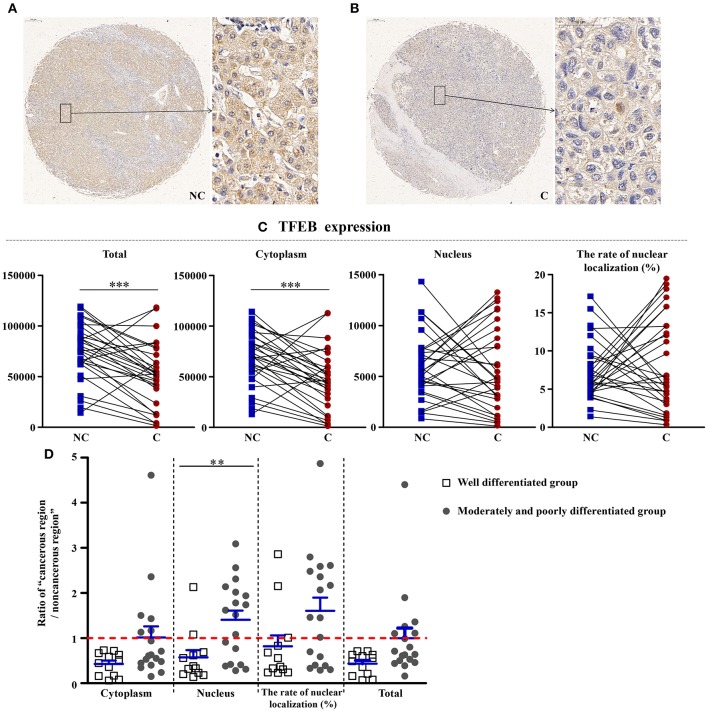
Figure 6.
The detailed expression of TFEB. Representative images of TFEB protein expression in liver cancer's corresponding (A) non-cancerous (NC) and (B) cancerous (C) regions. (C) Quantification of TFEB expression (total, cytoplasmic, and nuclear expressions and the rate of nuclear localization) levels using multispectral image analysis in the liver cancer samples. (D) The ratio of “cancerous region/non-cancerous region” of TFEB expression in two groups (well-differentiated group vs. moderately and poorly differentiated group). The red line indicates that the ratio is equal to 1. Scale bar: 200 or 50 μm. **Denotes significant differences from the well-differentiated group with P < 0.01; ***Denotes significant differences from the noncancerous region with P < 0.001.

