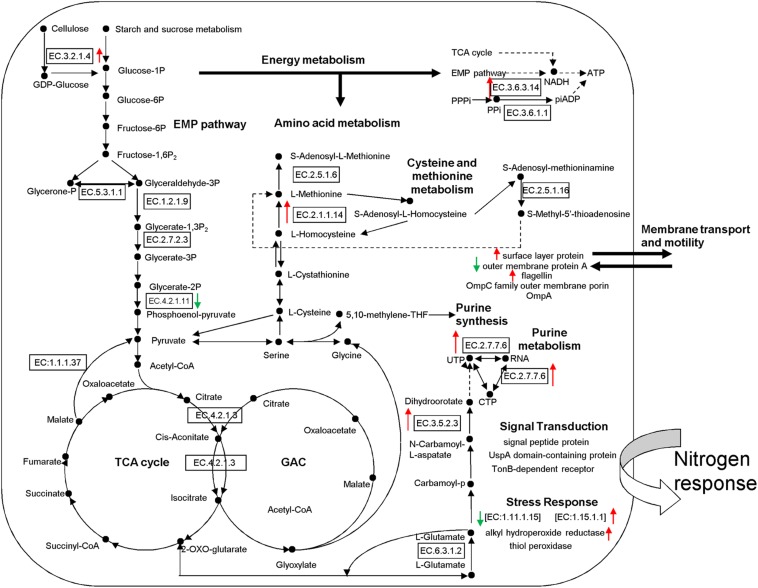
FIGURE 5.
Proposed metabolic model for rhizosphere soil proteins as inferred by metaproteomic data. Identification numbers [E.C.-.-.-.-.] refer to the identified proteins. Red Upward arrows indicate the up-regulated proteins and green downward arrows show the down-regulated proteins. EMP, Embden-Meyerhof pathway; TCA, tricarboxylic acid cycle; GAC, glyoxylic acid cycle.

