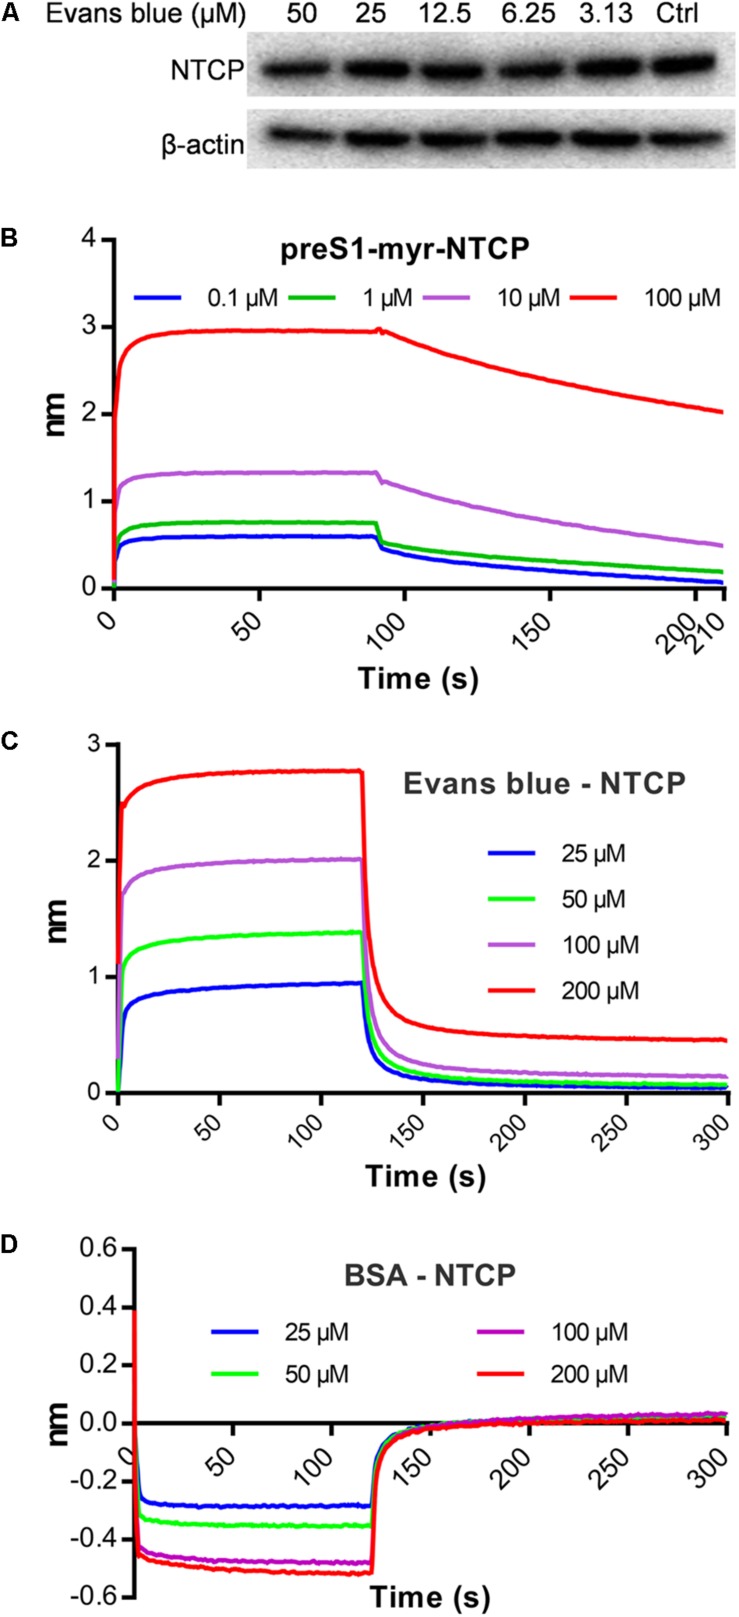
FIGURE 4.
Evans blue does not degrade NTCP but directly interacts with NTCP. (A) Huh7DhNTCP cells were treated with different concentrations of Evans blue for 72 h, cell lysates were digested with PNGaseF, and the levels of NTCP were determined by Western blot. Beta-actin was used as an internal reference marker. (B–D) A molecule interaction assay was conducted as described in Section “Materials and Methods.” The shift of wavelength represents the strength of the interaction between the test molecules. PreS1 (B) and BSA (D) were used as positive and negative controls, respectively. Curves correspond to the phases of association and dissociation of compounds at various concentrations on NTCP and BSA anchored to the sensor chip.

