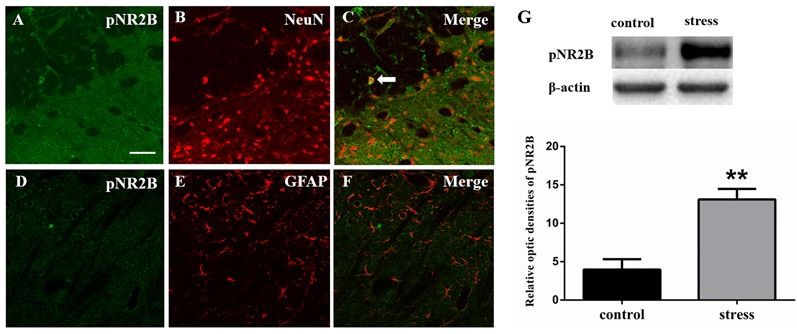
Figure 3.

Panels (A–F) show the double immunofluorescence of pNR2B with NeuN or GFAP. The arrow indicates the typical double-labeled cell. Scale bars = 50 μm. (G) The impression of pNR2B in control and stress group. **P < 0.01 vs. the control group, n = 4 in each group.
