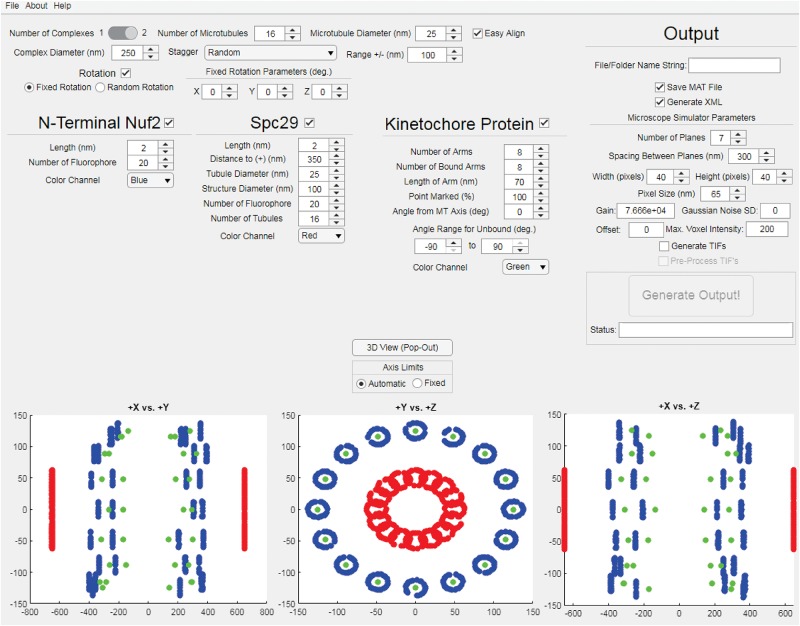
FIGURE 2.
Kinetochore Model Graphical User Interface. The interface of the StaticKinet MATLAB application used to generate simulated fluorescent images of kinetochore models. In the bottom three panels the red dots represent fluorophores bound to the minus ends of the kinetochore microtubules (to approximate the spindle pole bodies), the blue dots represent the N-termini of Nuf2 bound to the plus ends of the kinetochore microtubule, and the green dots represent a given kinetochore protein, i.e., Cse4.

