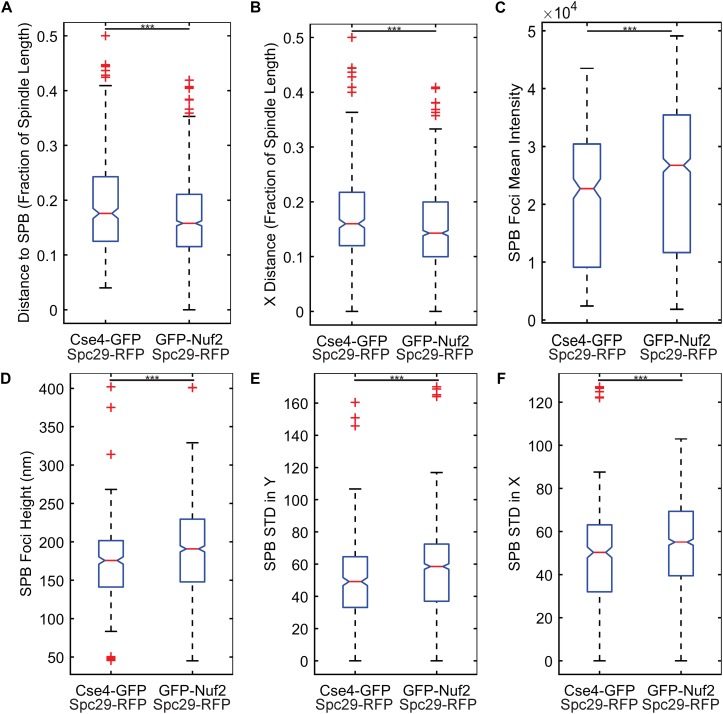
FIGURE 4.
Feature comparisons between GFP-Nuf2 and Cse4-GFP processed images. Boxplots comparing kinetochore foci distance to proximal spindle pole body (SPB) foci (A), kinetochore foci distance to proximal SPB foci in X-direction only (parallel to the spindle) (B), SPB foci intensity (C), SPB foci height (width of foci perpendicular to spindle) (D), standard deviation of the intensities generated from a line-scan of a SPB foci perpendicular to the spindle (E), standard deviation of the intensities generated from a line-scan of a SPB foci parallel to the spindle (F). The three asterisks indicate a p-value < 0.001 using a Wilcoxon rank sum test.

