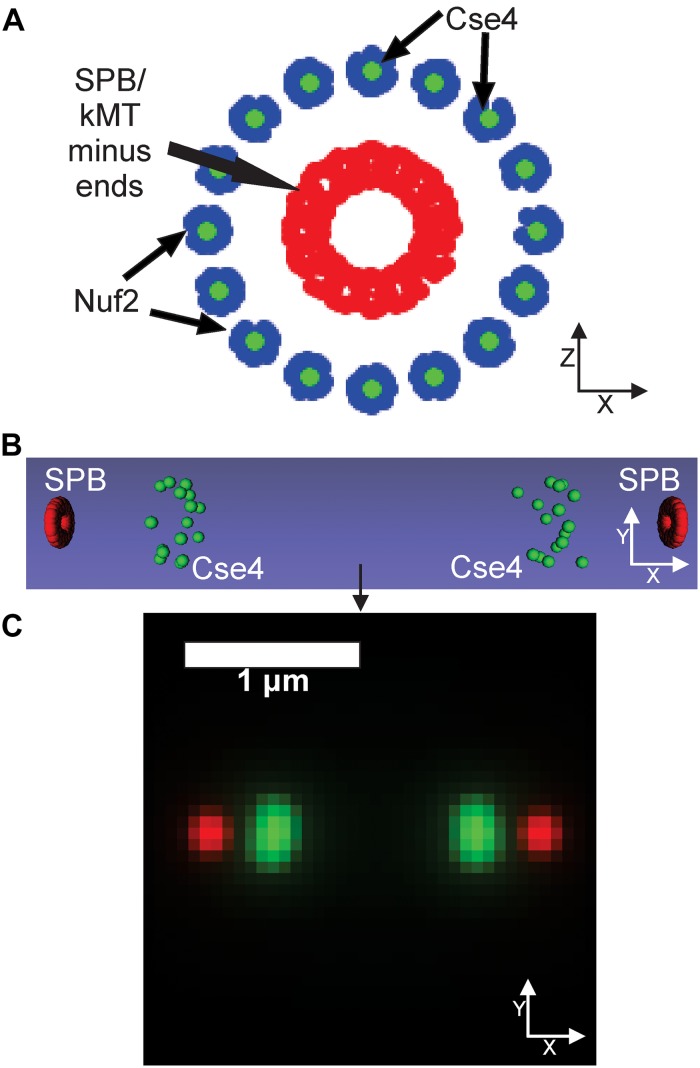
FIGURE 6.
Default kinetochore model organization. (A) Cartoon of the kinetochore model. The model is oriented end-on from the spindle, so the sister kinetochore complexes and SPBs (red dots) overlay each other. Cse4s (green dots) are located on the central axis of the microtubule. The N-termini of Nuf2 are blue dots (Joglekar et al., 2009) that bind the plus-end of the simulated kinetochore microtubules (kMTs), which are not shown. SPBs (red dots) are represented in our model as fluorophores surrounding the minus ends of the kMTs. (B) Side-view of the volumetric model, generated by the Microscope Simulator 2 program, of the organization that will be used for simulated, fluorescent image generation. (C) The simulated microscope image of the organization shown in panel (B).

