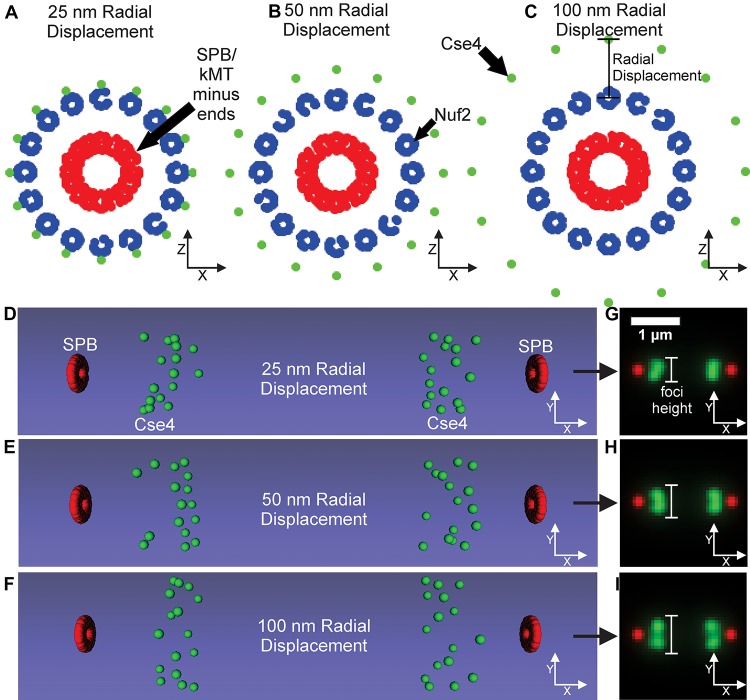
FIGURE 7.
Kinetochore model organization with Cse4 radially displaced from kinetochore microtubule axis. (A–C) Scatter plots depicting the end-on view of the 25, 50, and 100 nm radial displacement models. Cse4s are the green dots, N-termini of Nuf2 are the blue dots forming a ring around the kMT plus-ends, and the SPBs are composed of red dots surrounding the minus-ends of the kMTs. (D–F) Volumetric models, generated by the Microscope Simulator 2 program, of the 25, 50, and 100 nm radial displacement organizations that were used for simulated, fluorescent image generation. (G–I) The respective simulated microscope images to the volumetric models shown in panels (E,F). White bars indicate Cse4 foci height.

