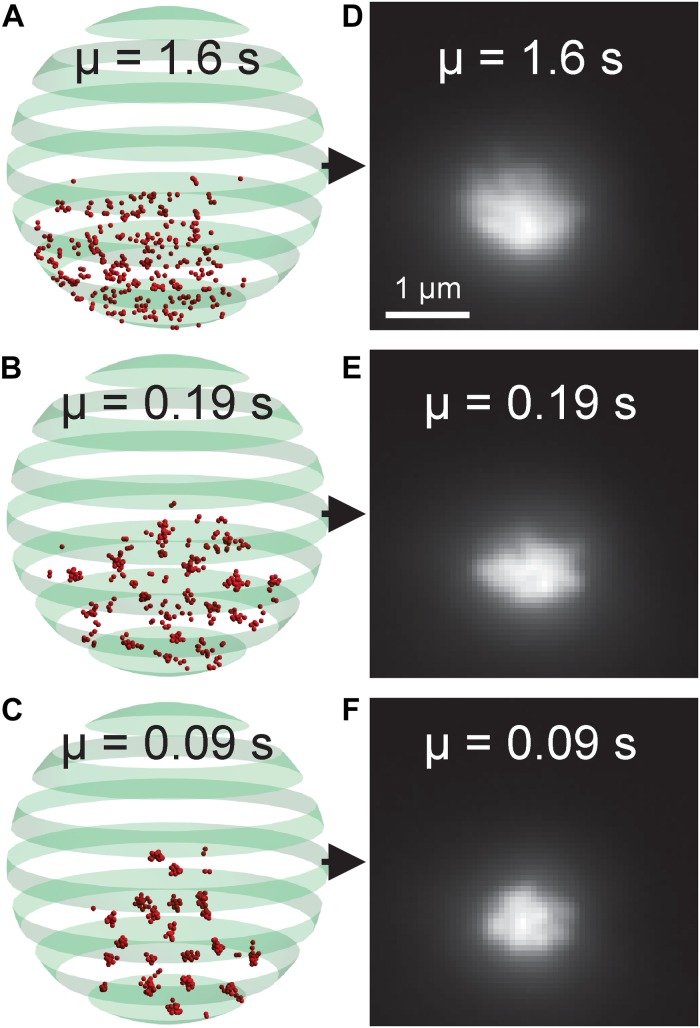
FIGURE 8.
Nucleolar model organization and simulated fluorescent images. (A–C) Volumetric model of the budding yeast nucleolus with differing bead-bead dynamic crosslinking durations. Red beads represent rDNA locus. The green banded sphere represents the nuclear membrane which acts as a boundary constraint in the simulation. (D–F) Simulated fluorescent images of the nucleolar models. The parameter μ indicates the average duration of a bead-bead crosslink.

